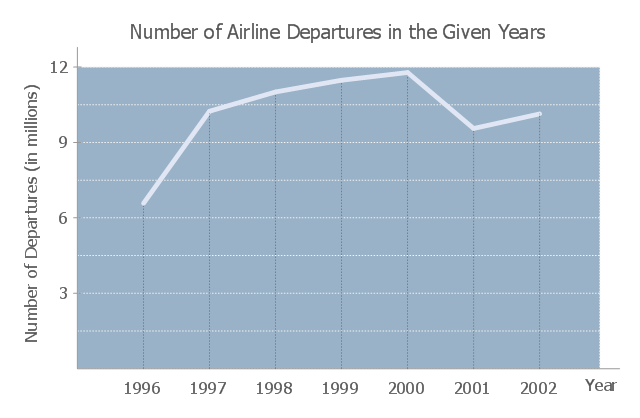
The line graph example "Number of airlines departures in the given years" was redesigned using the ConceptDraw PRO diagramming and vector drawing software from the Wikimedia Commons file: -6 time series.JPG
[commons.wikimedia.org/ wiki/ File:-6_ time_ series.JPG].
"The social science of economics makes extensive use graphs to better illustrate the economic principles and trends it is attempting to explain. Those graphs have specific qualities that are not often found (or are not often found in such combinations) in other sciences. ...
More generally, there is usually some mathematical model underlying any given economic graph. For instance, the commonly used supply-and-demand graph has its underpinnings in general price theory — a highly mathematical discipline." [Economic graph. Wikipedia]
The line graph example "Number of airlines departures in the given years" is included in the Line Graphs solution from the Graphs and Charts area of ConceptDraw Solution Park.
www.conceptdraw.com/ solution-park/ charts-line-graphs
Line chart
 Line Graphs
Line Graphs solution extends ConceptDraw PRO software with templates, samples and library of vector stencils for drawing the line charts.
Chart Examples

Line Chart Examples

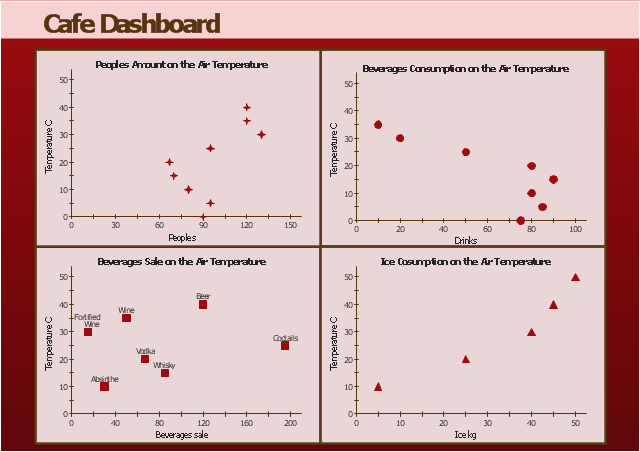
The scatter plots in this visual dashboard example are used to visualize correlations between the air temperature and the cafe business metrics: visitors number, beverage consumption, beverage sale, ice consumption.
"In statistics, dependence is any statistical relationship between two random variables or two sets of data. Correlation refers to any of a broad class of statistical relationships involving dependence. ...
Correlations are useful because they can indicate a predictive relationship that can be exploited in practice. ...
Formally, dependence refers to any situation in which random variables do not satisfy a mathematical condition of probabilistic independence. In loose usage, correlation can refer to any departure of two or more random variables from independence, but technically it refers to any of several more specialized types of relationship between mean values." [Correlation and dependence. Wikipedia]
The example "Air temperature correlations - Cafe dashboard" was created using the ConceptDraw PRO diagramming and vector drawing software extended with the Corellation Dashboard solution from the area "What is a Dashboard" of ConceptDraw Solution Park.
www.conceptdraw.com/ solution-park/ corellation-dashboard
- Basic Diagramming | Mathematical pendulum diagram | Venn ...
- Line Chart Examples | How to Create a Line Chart | Line Graph ...
- Line Graphs | Line Graph Charting Software | Design elements ...
- Line Chart Template for Word | How to Create a Line Chart | Line ...
- Line Graphs | Line Graph Charting Software | Line graph template ...
- Line Graphs
- Cafe Floor Plan. Cafe Floor Plan Examples
- Design elements - Correlation charts | Blank Scatter Plot ...
- Blank Scatter Plot | Scatter Chart Examples | Design elements ...
- Cafe performance metrics vs. air temperature - Visual dashboard ...
- KPIs and Metrics | Cafe performance metrics vs. air temperature ...
- ERD | Entity Relationship Diagrams, ERD Software for Mac and Win
- Flowchart | Basic Flowchart Symbols and Meaning
- Flowchart | Flowchart Design - Symbols, Shapes, Stencils and Icons
- Flowchart | Flow Chart Symbols
- Electrical | Electrical Drawing - Wiring and Circuits Schematics
- Flowchart | Common Flowchart Symbols
- Flowchart | Common Flowchart Symbols