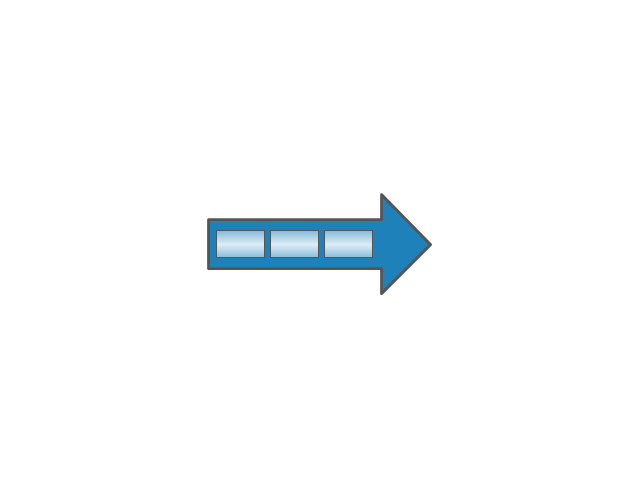
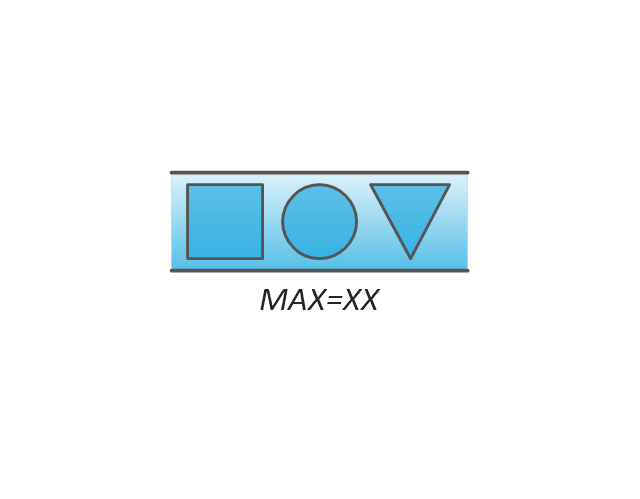
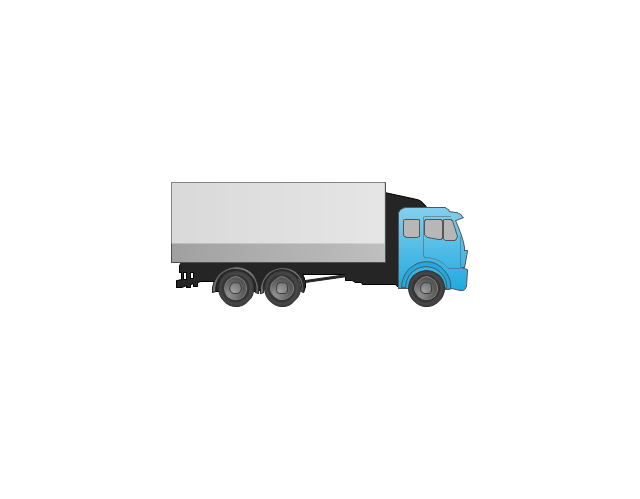
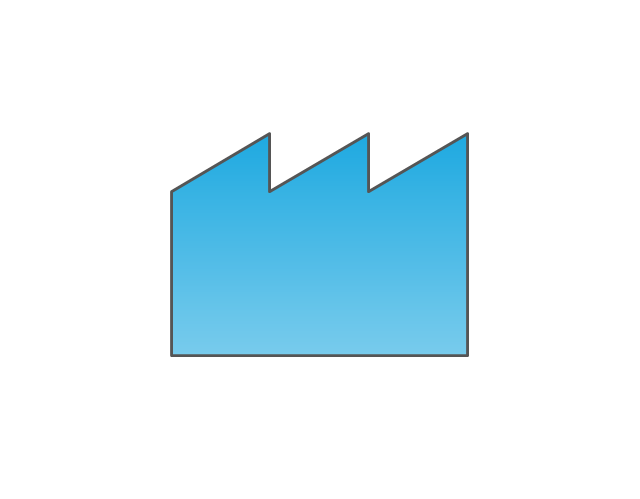
The vector stencils library "Value stream mapping" contains 43 VSM symbols.
Use it for drawing value stream maps in the ConceptDraw PRO diagramming and vector drawing software extended with the Value Stream Mapping solution from the Quality area of ConceptDraw Solution Park.
www.conceptdraw.com/ solution-park/ business-value-stream-mapping
Use it for drawing value stream maps in the ConceptDraw PRO diagramming and vector drawing software extended with the Value Stream Mapping solution from the Quality area of ConceptDraw Solution Park.
www.conceptdraw.com/ solution-park/ business-value-stream-mapping
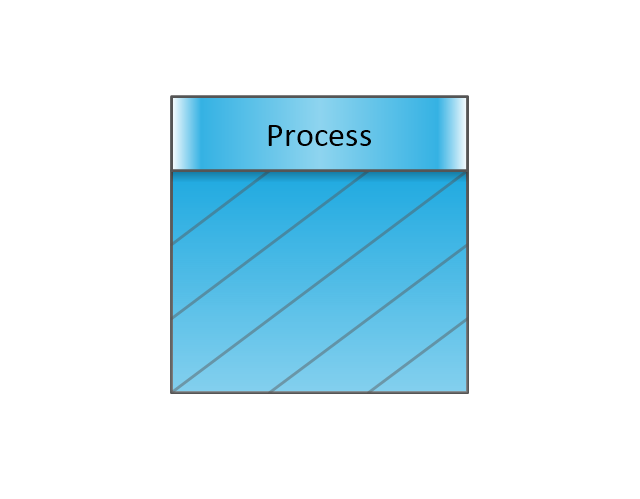
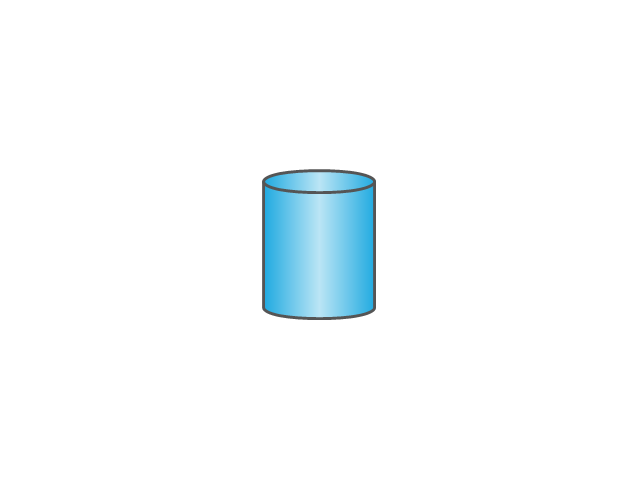
Inventory
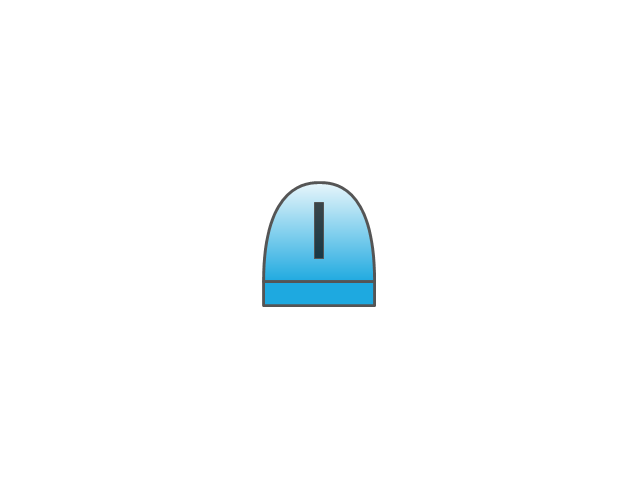
Inventory

Information Flow
Shipment
Shipment
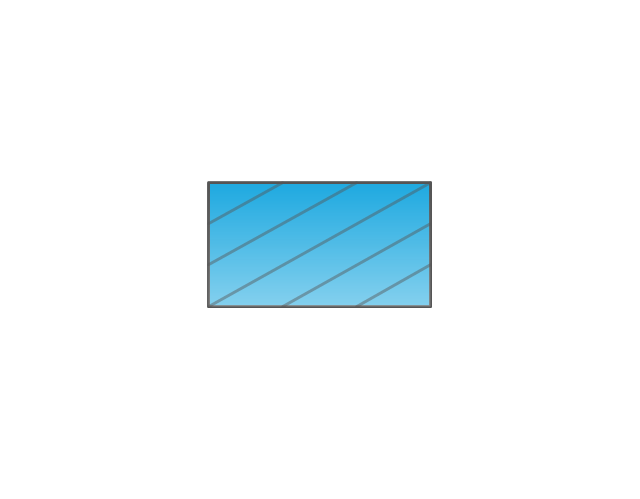
Material Flow
Material Pull

FIFO Line
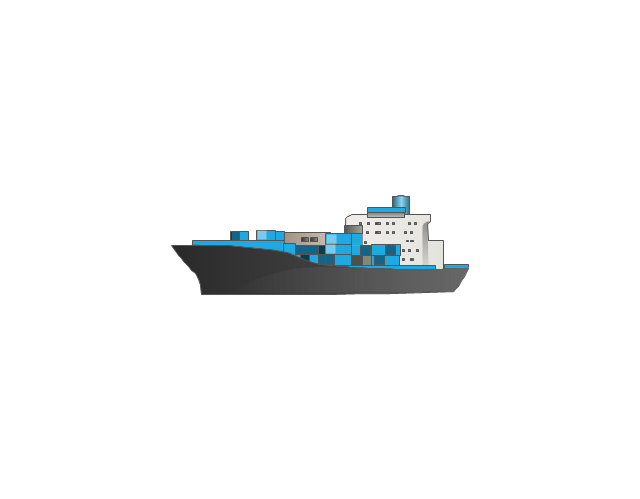
Truck shipment/Logistics
Customer/Supplier
Dedicated Process

Shared Process
Supermarket Parts
Data Box
Workcell
Kaizen Burst

Operator

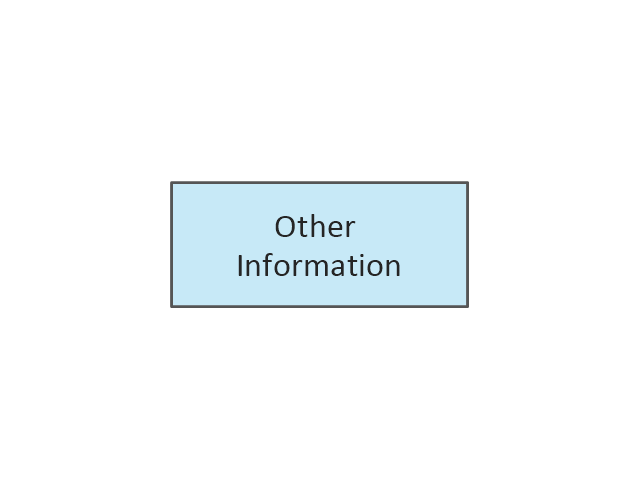
Other
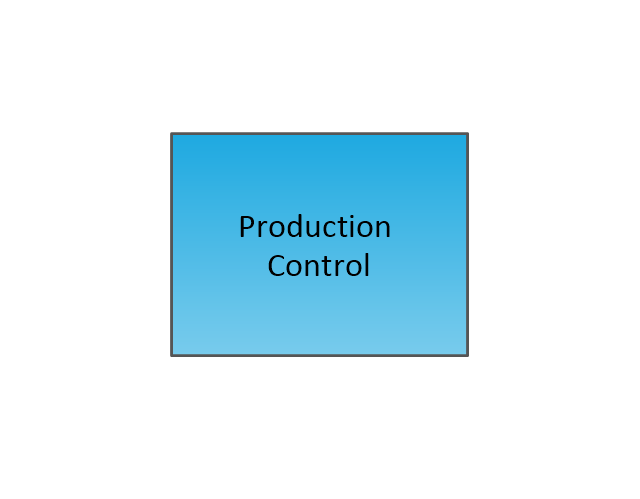
Production Control
Manual Info
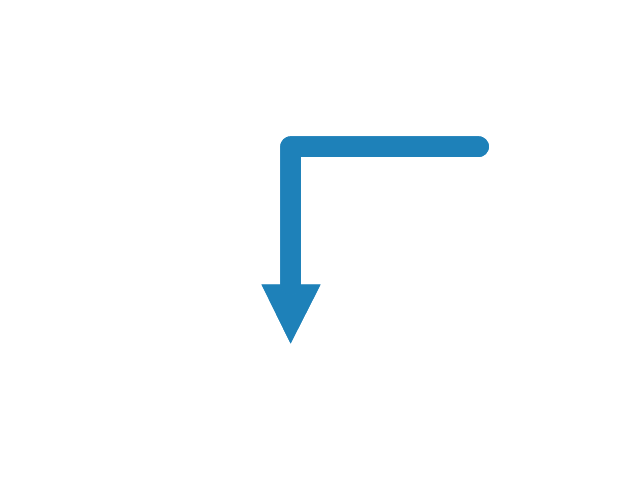
Electronic Information Flow
Production Kanban
Withdrawal Kanban
Signal Kanban
Kanban Post

Sequenced Pull
Load Levelling

MRP/ERP
Go-See

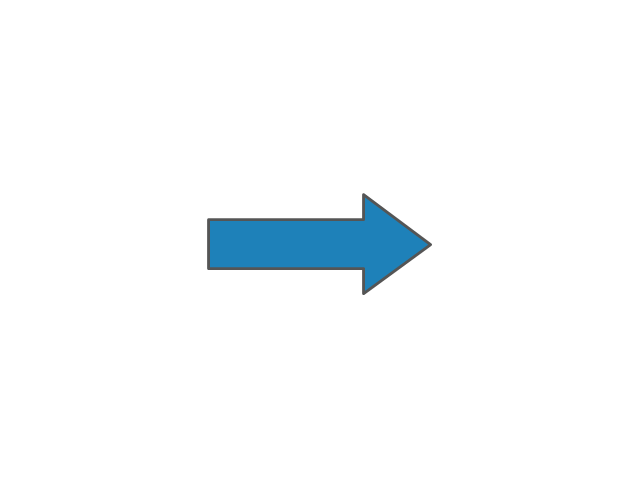
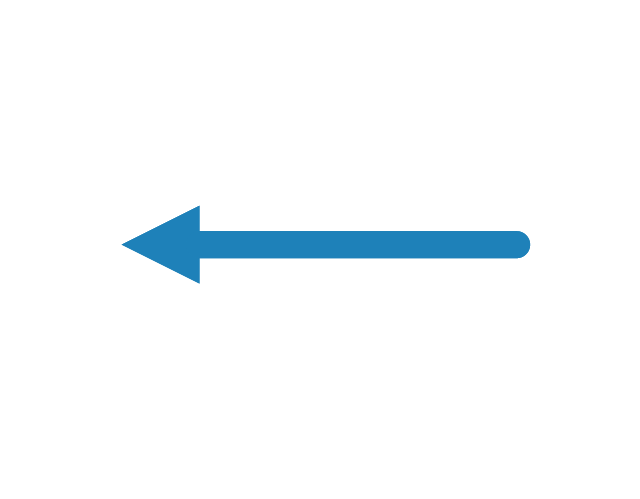
Pull Arrow
Manual Info
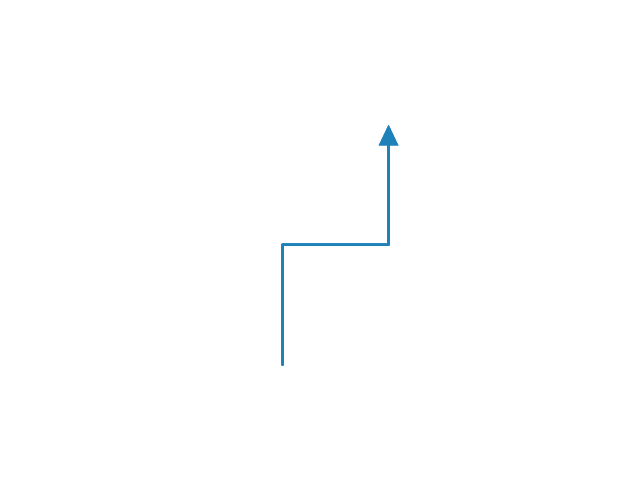
Pull Arrow
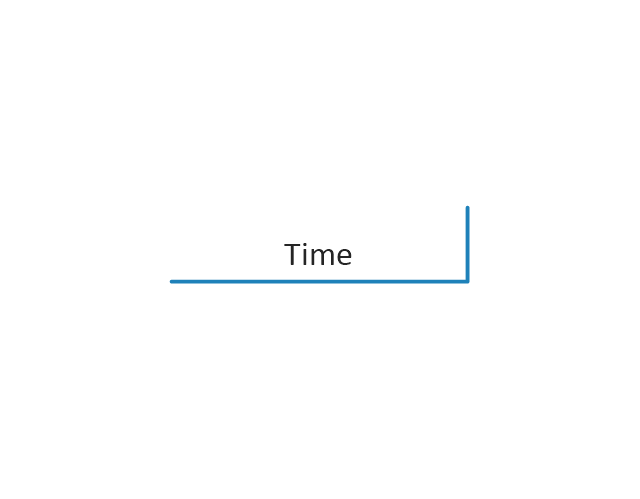
Timeline Total
Ship
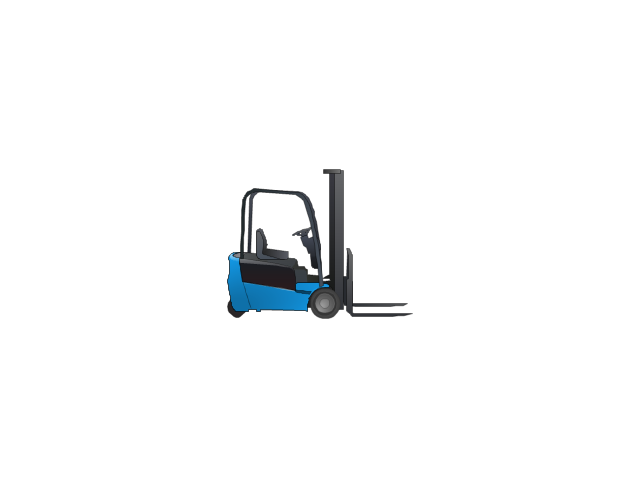
Forklift Truck
Plane

Process with Data
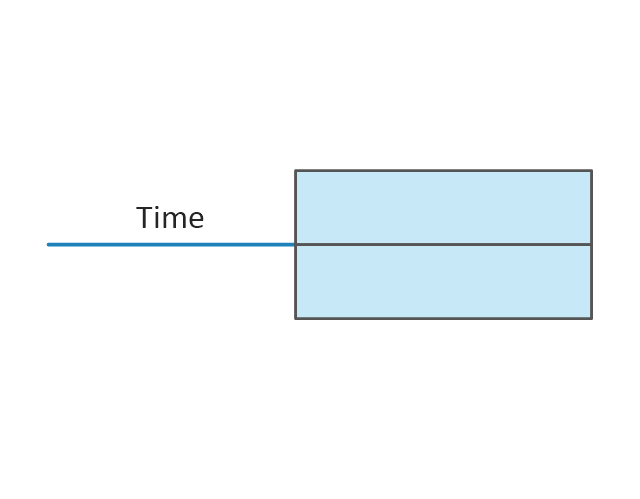
Timeline
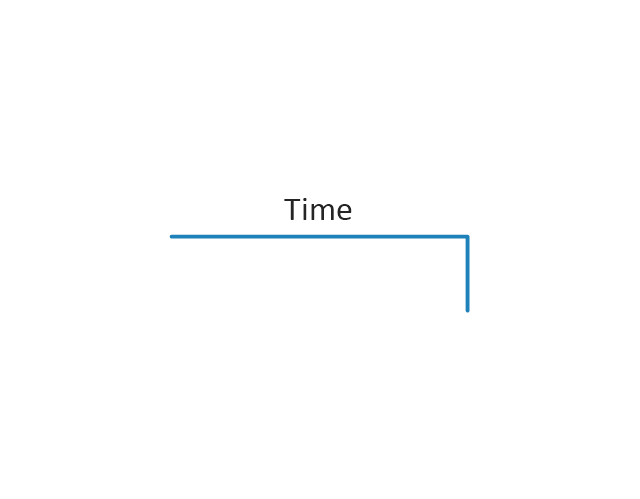
Timeline
Supermarket, 2

Supermarket, 3

Safety stock, 2
Safety stock, 3
Value Stream Mapping Symbols

 Business Process Mapping
The Business Process Mapping solution for ConceptDraw DIAGRAM is for users involved in process mapping and creating SIPOC diagrams.
The vector stencils library "Value stream mapping" contains 43 VSM symbols.
Use it for drawing value stream maps in the ConceptDraw PRO diagramming and vector drawing software extended with the Value Stream Mapping solution from the Quality area of ConceptDraw Solution Park.
www.conceptdraw.com/ solution-park/ business-value-stream-mapping
Use it for drawing value stream maps in the ConceptDraw PRO diagramming and vector drawing software extended with the Value Stream Mapping solution from the Quality area of ConceptDraw Solution Park.
www.conceptdraw.com/ solution-park/ business-value-stream-mapping
Inventory
Inventory
Information Flow
Shipment
Shipment
Material Flow
Material Pull
FIFO Line
Truck shipment/Logistics
Customer/Supplier
Dedicated Process
Shared Process
Supermarket Parts
Data Box
Workcell
Kaizen Burst
Operator
Other
Production Control
Manual Info
Electronic Information Flow
Production Kanban
Withdrawal Kanban
Signal Kanban
Kanban Post
Sequenced Pull
Load Levelling
MRP/ERP
Go-See
Pull Arrow
Manual Info
Pull Arrow
Timeline Total
Ship
Forklift Truck
Plane
Process with Data
Timeline
Timeline
Supermarket, 2
Supermarket, 3
Safety stock, 2
Safety stock, 3
 Workflow Diagrams
Workflow Diagrams solution extends ConceptDraw DIAGRAM software with samples, templates and vector stencils library for drawing the work process flowcharts.
HelpDesk
How to Create a Healthcare Management Workflow Diagram

HelpDesk
How to Create a Health Informatics Diagram

 Business Process Workflow Diagrams
The Business Process Workflow Diagrams solution enhances the ConceptDraw DIAGRAM functionality with predesigned examples, samples and a numerous collection of predesigned vector objects of workflow chart elements, icons, arrows, connectors, and varied wor
 Classic Business Process Modeling
The ConceptDraw DIAGRAM software enhanced with Classic Business Process Modeling solution is a powerful flowchart maker and professional business process modeling software with extensive choice of drawing tools, libraries with wide variety of ready-to-use vector objects that are more than sufficient for modeling the business processes and for instant creation variety of diagram types: Control Flow Diagram, Swimlane Diagram, Business Process Modeling Diagram, Functional Flow Block Diagram, Data Flow Diagram. It is ideal for business analysts, developers, as well as for managers and regular users. The samples included to Classic Business Process Modeling solution allow to uncover the solution’s power and to answer qualitatively on how to create a flowchart or to model the business processes with help of diagrams and schemes.
 Healthcare Management Workflow Diagrams
Healthcare Management Workflow Diagrams solution contains large set of colorful samples and libraries with predesigned vector pictograms and symbols of health, healthcare equipment, medical instruments, pharmaceutical tools, transport, medication, departments of healthcare organizations, the medical icons of people and human anatomy, as well as the predesigned flowchart objects, connectors and arrows, which make it the best for designing clear and comprehensive Medi?al Workflow Diagrams and Block Diagrams, Healthcare Management Flowcharts and Infographics, Healthcare Workflow Diagram, for depicting the healthcare workflow and clinical workflows in healthcare, for making the workflow analysis healthcare and healthcare workflow management.
, t chart, decision matrix, decision tree analysis") Decision Making
Decision Making
The Decision Making solution offers the set of professionally developed examples, powerful drawing tools and a wide range of libraries with specific ready-made vector decision icons, decision pictograms, decision flowchart elements, decision tree icons, decision signs arrows, and callouts, allowing the decision maker (even without drawing and design skills) to easily construct Decision diagrams, Business decision maps, Decision flowcharts, Decision trees, Decision matrix, T Chart, Influence diagrams, which are powerful in questions of decision making, holding decision tree analysis and Analytic Hierarchy Process (AHP), visual decomposition the decision problem into hierarchy of easily comprehensible sub-problems and solving them without any efforts.
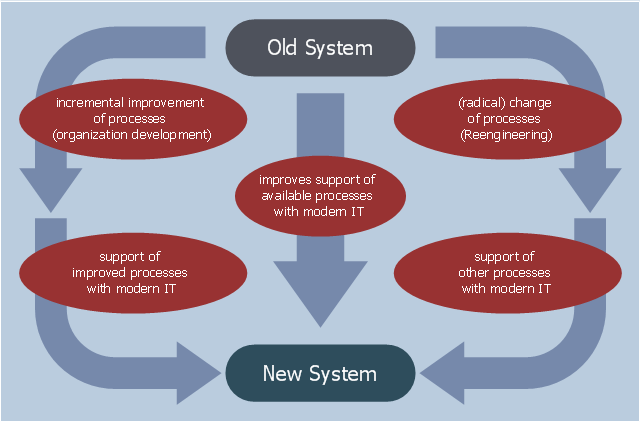
This example was designed on the base of the diagram "Organization Development vs. Business Process Reengineering" from the website of the Computer Science, Faculty 3, Bremen University. [informatik.uni-bremen.de/ gdpa/ part3/ p3gpo.htm]
"The efforts, behaviour, and performance of an employee in any organization for their growth is known as Organization development(OD).
Organization development (OD) is a field of research, theory and practice dedicated to expanding the knowledge and effectiveness of people to accomplish more successful organizational change and performance. ...
Key concepts of OD theory include: organizational climate (the mood or unique “personality” of an organization, which includes attitudes and beliefs that influence members’ collective behavior), organizational culture (the deeply-seated norms, values and behaviors that members share) and organizational strategies (how an organization identifies problems, plans action, negotiates change and evaluates progress)." [Organization development. Wikipedia]
The workflow diagram example "Organization Development vs. Business Process Reengineering" was created using ConceptDraw PRO software extended with the Business Process Workflow Diagrams solution from the Business Processes area of ConceptDraw Solution Park.
Workflow diagram
 Logistics Flow Charts
Logistics Flow Charts solution extends ConceptDraw DIAGRAM functionality with opportunities of powerful logistics management software. It provides large collection of predesigned vector logistic symbols, pictograms, objects and clipart to help you design with pleasure Logistics flow chart, Logistics process flow diagram, Inventory flow chart, Warehouse flowchart, Warehouse management flow chart, Inventory control flowchart, or any other Logistics diagram. Use this solution for logistics planning, to reflect logistics activities and processes of an enterprise or firm, to depict the company's supply chains, to demonstrate the ways of enhancing the economic stability on the market, to realize logistics reforms and effective products' promotion.
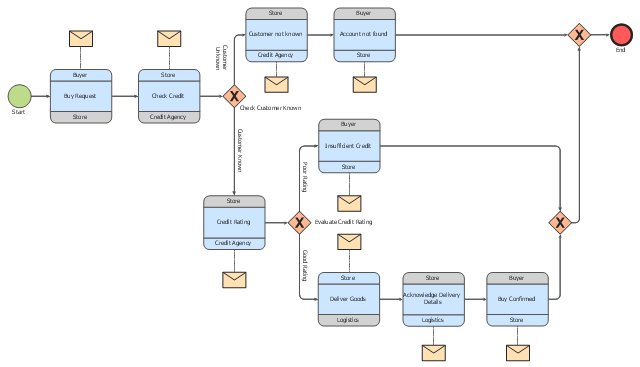
This choreography BPMN (Business Process Model and Notation) diagram sample shows the logistics workflow.
"Logistics is the management of the flow of goods between the point of origin and the point of consumption in order to meet some requirements, for example, of customers or corporations. The resources managed in logistics can include physical items, such as food, materials, animals, equipment and liquids, as well as abstract items, such as time, information, particles, and energy. The logistics of physical items usually involves the integration of information flow, material handling, production, packaging, inventory, transportation, warehousing, and often security. The complexity of logistics can be modeled, analyzed, visualized, and optimized by dedicated simulation software. The minimization of the use of resources is a common motivation in logistics for import and export." [Logistics. Wikipedia]
The business process modeling diagram example "Logistics - Choreography BPMN 2.0 diagram" was designed using the ConceptDraw PRO diagramming and vector drawing software extended with the Business Process Diagram solution from the Business Processes area of ConceptDraw Solution Park.
Business process modeling
 Sales Flowcharts
The Sales Flowcharts solution lets you create and display sales process maps, sales process workflows, sales steps, the sales process, and anything else involving sales process management.
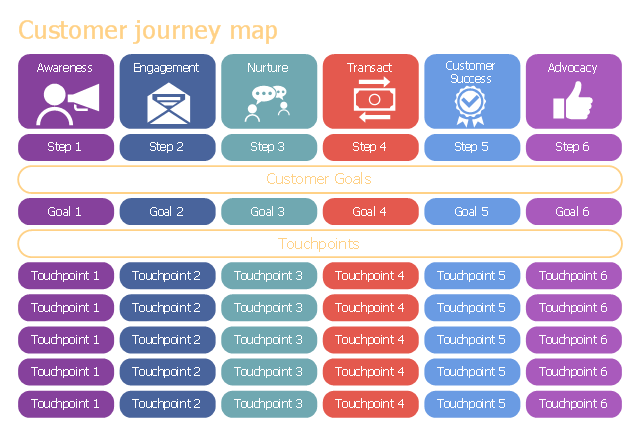
Use this CJM template for customer journey mapping with ConceptDraw DIAGRAM software.
"Digital customer journey.
Since the rise of the World Wide Web and smartphone applications, there are many more touch points from new content serving platforms (Facebook, Twitter, YouTube etc.), individual online presences (such as websites, forums, blogs, etc.) and dedicated smartphone applications.
As a result, this process has become a type of "journey":
1. The number of brands does not decrease during the process of evaluating and purchasing a product.
2. Brands not taken into account in the "awareness" stage may be added during the evaluation or even purchase stage.
3. Following the post-purchase stage, there is a return to the first step in the process, thus feeding the brand awareness.
In relation to customers and the channels which are associated with sales, these are multichannel in nature. Due to the growth and importance of social media and digital advancement, these aspects need to be understood by businesses to be successful in this era of customer journeys. With tools such as Facebook and Twitter having such prominence, there is a constant stream of data that needs to be analysed to understand this journey. Business flexibility and responsiveness is vital in the ever-changing digital customer environment, as customers are constantly connected to businesses and their products. Customers are now instant product experts due to various digital outlets and form their own opinions on how and where to consume products and services. Businesses use customer values and create a plan to gain a competitive advantage. Businesses use the knowledge of customers to guide the customer journey to their products and services.
Due to the shift in customer experience, in 2014 Wolny & Charoensuksai highlight three behaviours that show how decisions can be made in this digital journey. The Zero Moment of truth is the first interaction a customer has in connection with a service or product. This moment affects the consumer's choice to explore a product further or not at all. These moments can occur on any digital device. Showrooming highlights how a consumer will view a product in a physical store but then decide to exit the store empty handed and buy online instead. This consumer decision may be due to the ability to compare multiple prices online. On the opposing end of the spectrum is webrooming. Consumers will research about a product online in regards to quality and price but then decide to purchase in store. These three channels need to be understood by businesses because customers expect businesses to be readily available to cater to their specific customer needs and purchasing behaviours." [Customer experience. Wikipedia]
The CJM template "Customer journey" is included in Customer Journey Mapping solution from Marketing area of ConceptDraw Solution Park.
Virtual private networks (VPN). Computer and Network Examples
. <br>Computer and Network Examples *")
This example was created in ConceptDraw DIAGRAM using the Computer and Networks Area of ConceptDraw Solution Park and shows the Virtual Private Network (VPN) diagram.

 Business Productivity Area
Business Productivity Solutions extend ConceptDraw products with tools for making presentations, conducting meetings, preparing documents, brainstorming, or building new strategies.
 PM Docs
PM Docs solution from ConceptDraw Solution Park extends ConceptDraw MINDMAP software with the ability to create and organize the project and company documentation, to structure information that relates to your project, to link the project documentation to tasks, phases, and resources. This solution contributes for improvement the project management abilities and enhancement the productivity of project team, makes it easier to locate the pertinent documentation over the life of a project, beginning from its planning, improves the document access and minimizes search time, lets to link or embed documentation into the project topics, helps create document, design professional Mind Maps, link the correct documents to keep them organized in a project, sort the project documents and visually differentiate the document types.
- Cross-Functional Flowcharts | Site Plans | Food Court | Supermarket ...
- Value stream mapping diagram
- Process Flow Chart For Freight And Vehicles Control
- Supermarket parking | Value stream mapping - Vector stencils ...
- Business Processes | Business Process Mapping | Timeline ...
- Business Process Mapping — How to Map a Work Process ...
- What is Value Stream Mapping?
- Conceptual diagram of the Kanban System | Value stream mapping ...
- Inventory Performance Dynamics Dashboard | Value stream ...
- Shipping And Logistics Process Flow Chart
- Logistics Flow Charts | Value stream mapping - Vector stencils ...
- Value stream mapping - Vector stencils library | Design elements ...
- Value stream mapping - Vector stencils library | Circuits and Logic ...
- Value stream map - Template | Design elements - Value stream ...
- Kanban Board Software | Conceptual diagram of the Kanban ...
- Peru wheat area and production | 4 Ms fishbone diagram ...
- Value stream mapping - Vector stencils library
- Logistics Flow Charts | Intermodal transport chain | Aerospace and ...
- Kanban Board Software | Scrum Workflow | Scrum board | Kanban ...
- Value stream mapping - Vector stencils library
- ERD | Entity Relationship Diagrams, ERD Software for Mac and Win
- Flowchart | Basic Flowchart Symbols and Meaning
- Flowchart | Flowchart Design - Symbols, Shapes, Stencils and Icons
- Flowchart | Flow Chart Symbols
- Electrical | Electrical Drawing - Wiring and Circuits Schematics
- Flowchart | Common Flowchart Symbols
- Flowchart | Common Flowchart Symbols