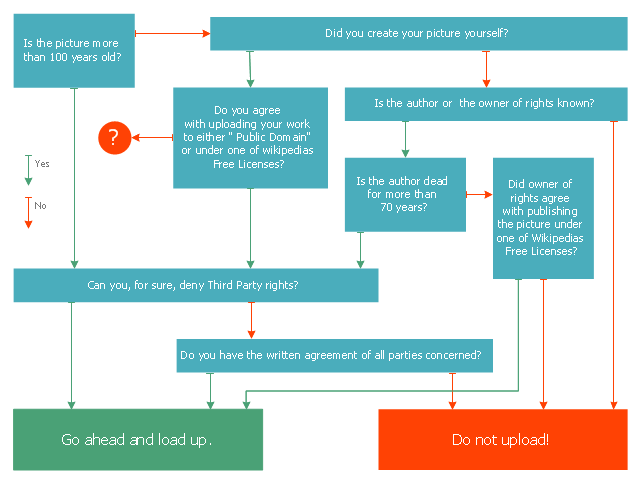
This marketing diagram sample represents decision tree. It was redesigned from the Wikimedia Commons file: Decision Tree on Uploading Imagesv2.svg.
[commons.wikimedia.org/ wiki/ File:Decision_ Tree_ on_ Uploading_ Imagesv2.svg]
"A decision tree is a decision support tool that uses a tree-like graph or model of decisions and their possible consequences, including chance event outcomes, resource costs, and utility. It is one way to display an algorithm.
Decision trees are commonly used in operations research, specifically in decision analysis, to help identify a strategy most likely to reach a goal. ...
A decision tree is a flowchart-like structure in which internal node represents test on an attribute, each branch represents outcome of test and each leaf node represents class label (decision taken after computing all attributes). A path from root to leaf represents classification rules.
In decision analysis a decision tree and the closely related influence diagram is used as a visual and analytical decision support tool, where the expected values (or expected utility) of competing alternatives are calculated.
A decision tree consists of 3 types of nodes:
(1) Decision nodes - commonly represented by squares.
(2) Chance nodes - represented by circles.
(3) End nodes - represented by triangles.
Decision trees are commonly used in operations research, specifically in decision analysis, to help identify a strategy most likely to reach a goal." [Decision tree. Wikipedia]
The marketing diagram example "Decision tree" was created using the ConceptDraw PRO diagramming and vector drawing software extended with the Marketing Diagrams solution from the Marketing area of ConceptDraw Solution Park.
Marketing flowchart
Decision Making

The Seven Management and Planning Tools is a set for such diagrams: Affinity Diagram, Relations Diagram, Prioritization Matrix, Root Cause Tree Diagram, Involvement Matrix, PERT Chart, Risk Diagram (PDPC).

 Marketing Diagrams
Marketing Diagrams solution extends ConceptDraw PRO diagramming software with abundance of samples, templates and vector design elements intended for easy graphical visualization and drawing different types of Marketing diagrams and graphs, including Branding Strategies Diagram, Five Forces Model Diagram, Decision Tree Diagram, Puzzle Diagram, Step Diagram, Process Chart, Strategy Map, Funnel Diagram, Value Chain Diagram, Ladder of Customer Loyalty Diagram, Leaky Bucket Diagram, Promotional Mix Diagram, Service-Goods Continuum Diagram, Six Markets Model Diagram, Sources of Customer Satisfaction Diagram, etc. Analyze effectively the marketing activity of your company and apply the optimal marketing methods with ConceptDraw PRO software.
How to Design Landscape

Influence Diagram Software

This sample shows the Influence diagram. It is a directed acyclic graph with three types of nodes: Decision node is drawn as a rectangle, Uncertainty node is drawn as an oval, Value node is drawn as an octagon. The nodes are connected with arcs.
Influence Diagram

Influence diagram represents the directed acyclic graph with three types of nodes and three types of arcs that connect the nodes. Decision node is drawn as a rectangle, Uncertainty node is drawn as an oval, Value node is drawn as an octagon.
MS Visio Look a Like Diagrams

ConceptDraw PRO delivers full-functioned alternative to MS Visio. ConceptDraw PRO supports import of Visio files. ConceptDraw PRO supports flowcharting, swimlane, orgchart, project chart, mind map, decision tree, cause and effect, charts and graphs, and many other diagram types.
Marketing Charts

Activity Network (PERT) Chart

This diagram is constructed as part of the process in creating a schedule of corrective actions. The Activity Network Chart (PERT) shows the logical connections and consequence of tasks to be performed. It displays the time period for problem solving and the implementation of all activities through the critical path.
Cross-Functional Flowchart

Use cross-functional flowcharts to show the relationship between a business process and the functional units (such as departments) responsible for that process. To create it use the best flowchart maker of ConceptDraw PRO.

Network Topologies

Easy to draw network topology, physical network, logical network, network mapping, home area networks (HAN), wireless network, cisco network topologies, fully connected network topology, bus network topology, star network topology, ring network topology, mesh network topology, tree network topology.

Types of Flowcharts


ConceptDraw Arrows10 Technology

- points;
- Connecting groups of objects;
- Auto-routing;
- Connectors text;
- Snap to Guides ;
- Quick.
How to Draw Business Process Diagrams with RapidDraw Interface

- Decision tree diagram
- Decision tree diagram | Marketing Diagrams | How To Create Root ...
- Decision tree diagram | Marketing Diagrams | Influence Diagram ...
- Types of Welding in Flowchart | Decision tree diagram | Computer ...
- Root cause analysis tree diagram - Template | PROBLEM ...
- Decision Tree Template Visio
- Decision Tree Template
- How To Create Root Cause Analysis Diagram | Types of Flowcharts ...
- Decision Tree Maker
- Decision Tree Diagram For Online Shopping Managment System
- How to Create a Fault Tree Analysis Diagram (FTD) in ConceptDraw ...
- Decision Analysis Flow Chart
- PROBLEM ANALYSIS. Root Cause Analysis Tree Diagram | Fault ...
- Visio Tree Diagram
- PROBLEM ANALYSIS. Root Cause Analysis Tree Diagram | Project ...
- Fault Tree Analysis Diagrams | Cause and Effect Analysis | Fault ...
- Process decision program chart (PDPC) - Personal activity | Risk ...
- Decision Making | Block diagram - Customer decision making ...
- Mac Tree Chart
- Root Cause Analysis Mac
- ERD | Entity Relationship Diagrams, ERD Software for Mac and Win
- Flowchart | Basic Flowchart Symbols and Meaning
- Flowchart | Flowchart Design - Symbols, Shapes, Stencils and Icons
- Flowchart | Flow Chart Symbols
- Electrical | Electrical Drawing - Wiring and Circuits Schematics
- Flowchart | Common Flowchart Symbols
- Flowchart | Common Flowchart Symbols