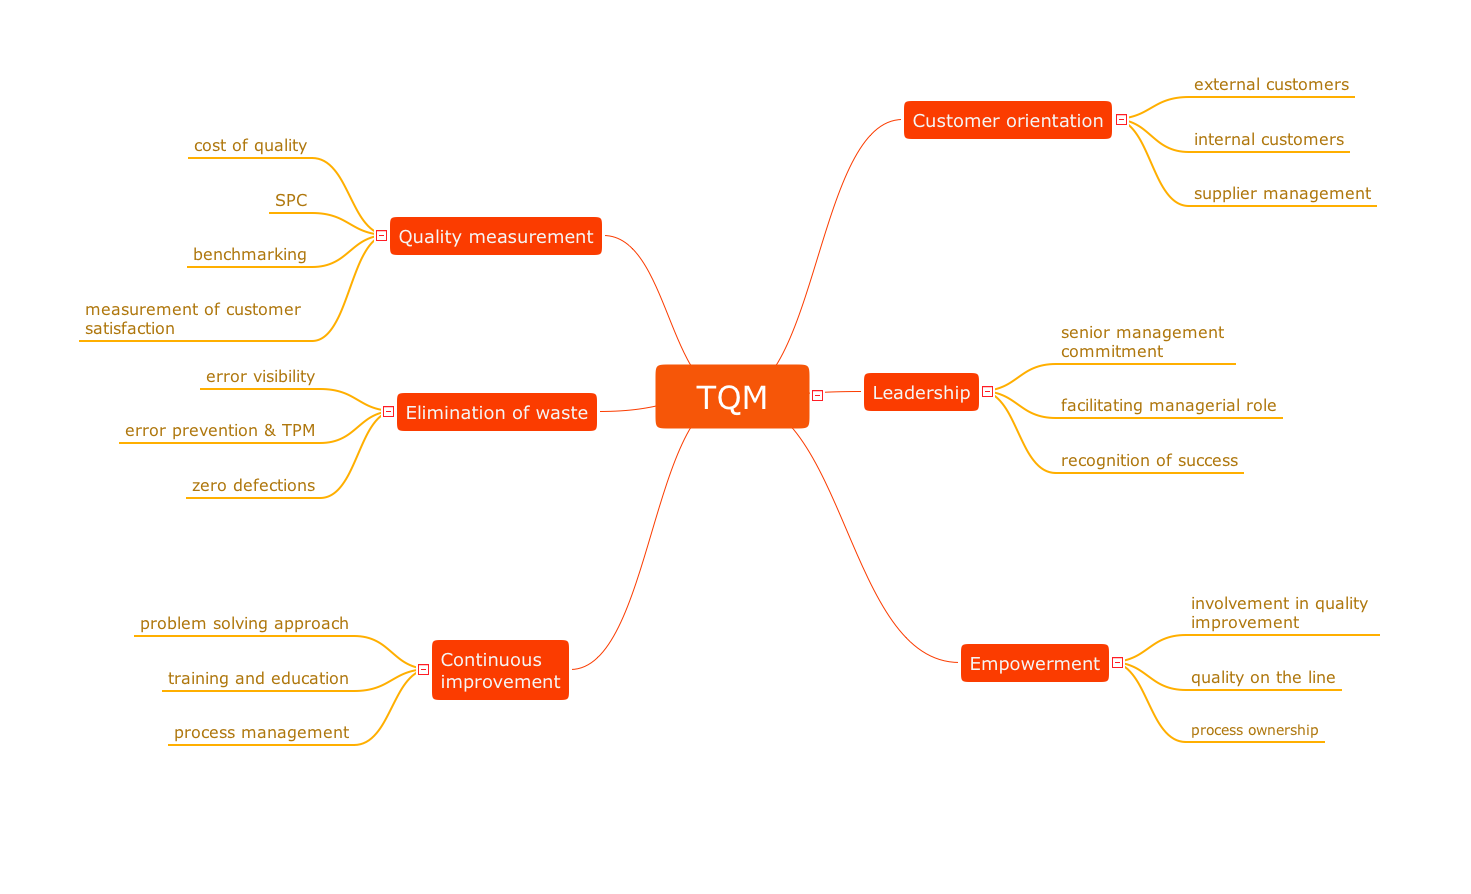
Total Quality Management Business Diagram

Decision Making

The Seven Management and Planning Tools is a set for such diagrams: Affinity Diagram, Relations Diagram, Prioritization Matrix, Root Cause Tree Diagram, Involvement Matrix, PERT Chart, Risk Diagram (PDPC).

TQM Diagram Tool

TQM Diagram — Professional Total Quality Management

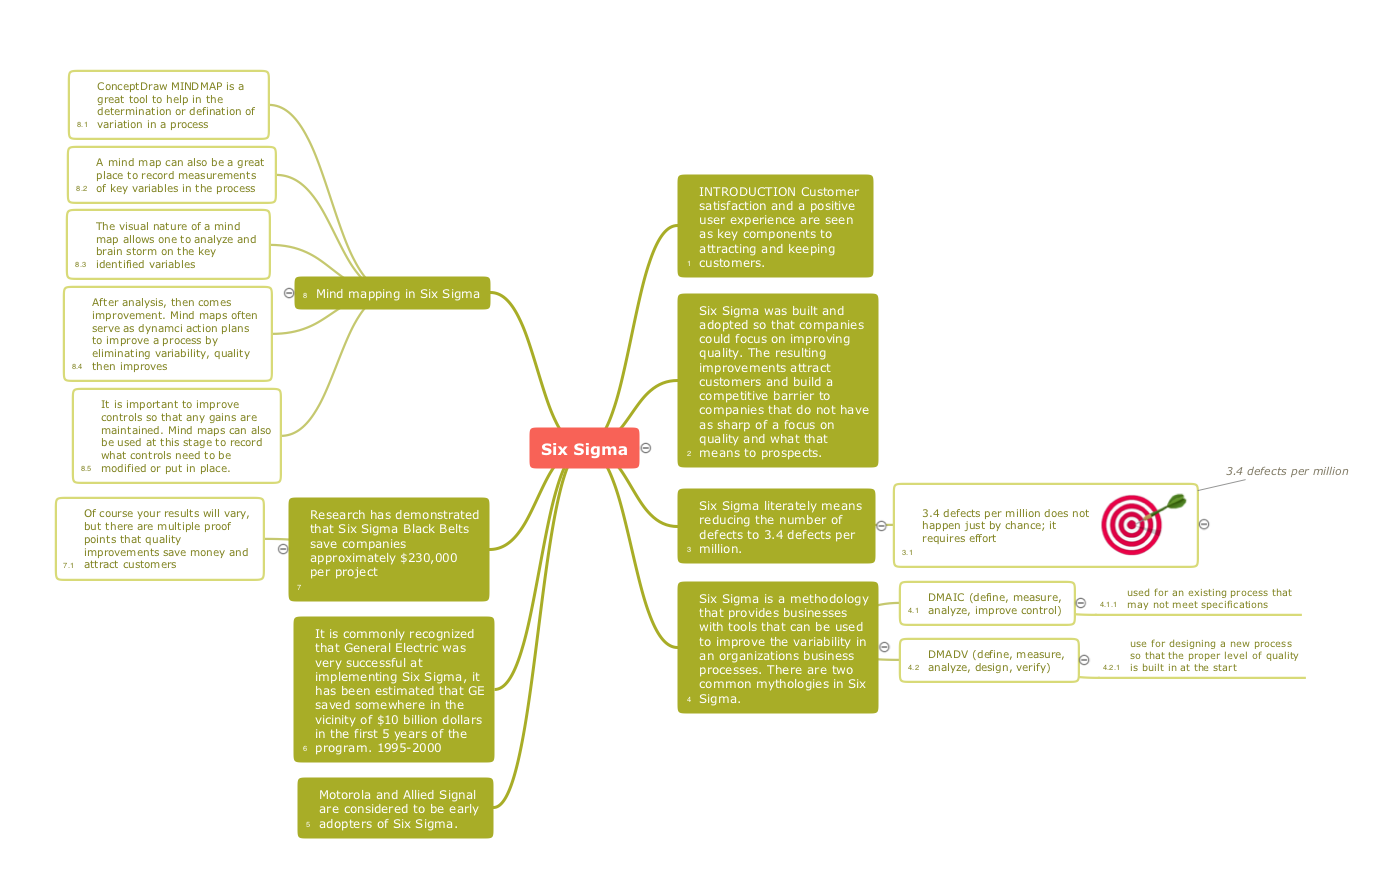
Quality Project Management with Mind Maps

Quality Management Teams

Helpful in all stages of quality management
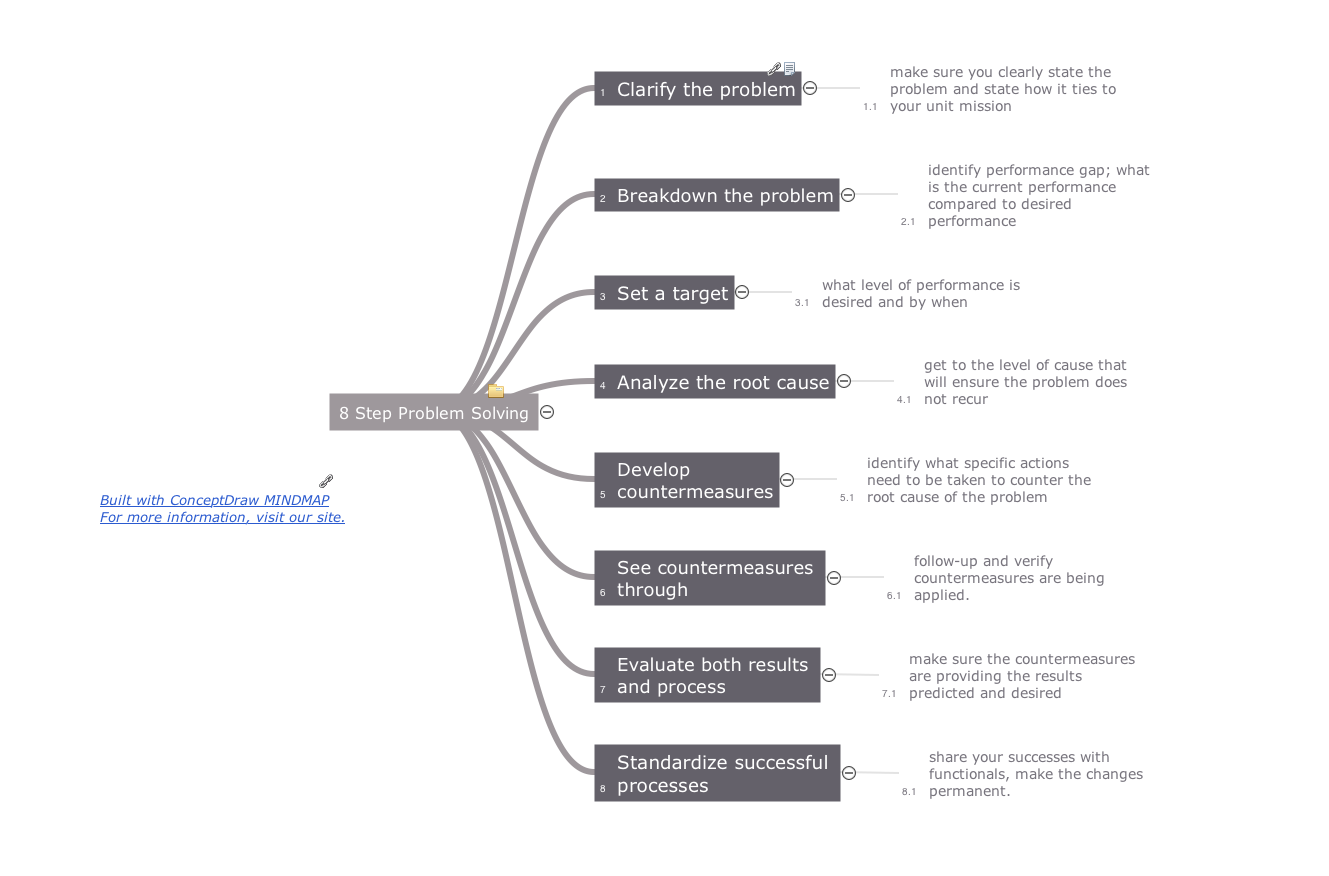
PROBLEM ANALYSIS. Root Cause Analysis Tree Diagram

ConceptDraw Office suite is a software for problem analysis.
Why do you need the quality management for the organization
Quality Management Mind Maps - Presentations, Meeting Agendas, Problem will be solved.
 Total Quality Management TQM Diagrams
Total Quality Management Diagrams solution extends ConceptDraw DIAGRAM software with samples, templates and vector stencils library for drawing the TQM flowcharts.
Workflow Diagram

The workflow represents the transferring of data, documents or tasks during a work process. To make it easier to study and analyze working processes, and to present them in a simple visual manner, workflow diagrams are used. To create these diagrams professional use workflow diagram maker software ConceptDraw DIAGRAM.
 Marketing Diagrams
Marketing Diagrams solution extends ConceptDraw DIAGRAM diagramming software with abundance of samples, templates and vector design elements intended for easy graphical visualization and drawing different types of Marketing diagrams and graphs, including Branding Strategies Diagram, Five Forces Model Diagram, Decision Tree Diagram, Puzzle Diagram, Step Diagram, Process Chart, Strategy Map, Funnel Diagram, Value Chain Diagram, Ladder of Customer Loyalty Diagram, Leaky Bucket Diagram, Promotional Mix Diagram, Service-Goods Continuum Diagram, Six Markets Model Diagram, Sources of Customer Satisfaction Diagram, etc. Analyze effectively the marketing activity of your company and apply the optimal marketing methods with ConceptDraw DIAGRAM software.
Quality Control

Quality Improvement
Using Fishbone Diagrams for Problem Solving

Using Fishbone Diagrams for Problem Solving is a productive and illustrative tool to identify the most important factors causing the trouble. ConceptDraw DIAGRAM extended with Fishbone Diagrams solution from the Management area of ConceptDraw Solution Park is a powerful tool for problem solving with Fishbone Ishikawa diagram graphic method.
- Decision Tree Tqm
- Decision Tree In Total Quality Management
- Decision tree diagram | Total Quality Management Business ...
- Decision Tree In Tqm
- Total Quality Management Business Diagram | Fault Tree Diagram ...
- PROBLEM ANALYSIS. Root Cause Analysis Tree Diagram | TQM ...
- Project Management Decision Tree
- Quality Improvement | Process Flowchart | TQM Tools | Decision ...
- Decision Tree Structure
- Decision Making | Influence Diagram | Fault Tree Diagram | Decision ...
- PROBLEM ANALYSIS. Root Cause Analysis Tree Diagram | TQM ...
- Simple Tree Diagram Example Tqm
- What Is Tree Diagram In Total Quality Management
- Quality Management Decision Flow Chart
- Decision Tree Map
- Simple Decision Tree Problems And Solutions
- Decision Making | Fault Tree Diagram | Influence Diagram | Decision ...
- Basic Flowchart Symbols and Meaning | Decision Making | Total ...
- Process Flowchart | Block Diagrams | Wireframing | Decision Tree ...
- Decision Tree Analysis In Project Management Ppt
- ERD | Entity Relationship Diagrams, ERD Software for Mac and Win
- Flowchart | Basic Flowchart Symbols and Meaning
- Flowchart | Flowchart Design - Symbols, Shapes, Stencils and Icons
- Flowchart | Flow Chart Symbols
- Electrical | Electrical Drawing - Wiring and Circuits Schematics
- Flowchart | Common Flowchart Symbols
- Flowchart | Common Flowchart Symbols