How To Make the Right Decision in Projects


Root Cause Analysis

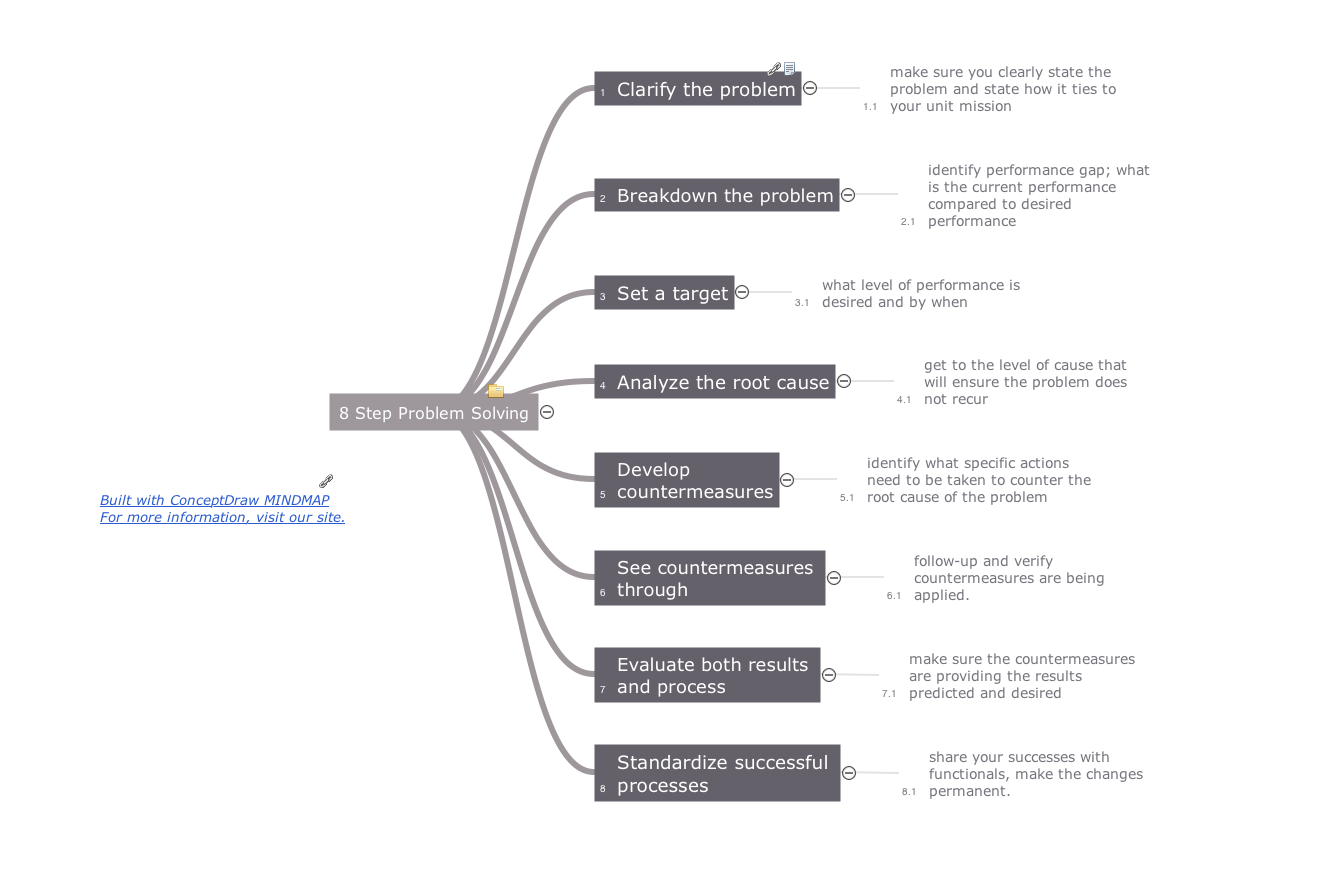
Analyze the root causes for factors that influenced the problem. This diagram is constructed separately for each highly prioritized factor. The goal of this is to find the root causes for the factor and list possible corrective action.

Decision Making

The Seven Management and Planning Tools is a set for such diagrams: Affinity Diagram, Relations Diagram, Prioritization Matrix, Root Cause Tree Diagram, Involvement Matrix, PERT Chart, Risk Diagram (PDPC).
PROBLEM ANALYSIS. Identify and Structure Factors

ConceptDraw OFFICE suite is a software for identify and structure factors with affinity diagram. This is a grouping and structuring of factors that impact on a problem.
Quality Management Teams
Decision Making Software For Small Business

Why People Select ConceptDraw MINDMAP

Business Productivity - Management

intelligent vector graphics that are useful for management diagramming and
ConceptDraw MINDMAP for key management mind maps.
Influence Diagram Software

This sample shows the Influence diagram. It is a directed acyclic graph with three types of nodes: Decision node is drawn as a rectangle, Uncertainty node is drawn as an oval, Value node is drawn as an octagon. The nodes are connected with arcs.
- Decision Tools Suite For Mac
- Decision Tree Software Free Mac
- Root Cause Analysis Mac
- Conceptdraw.com: Mind Map Software, Drawing Tools | Project ...
- Decision tree diagram | Decision Making | Fault Tree Diagram ...
- Download and Install ConceptDraw Office on Mac | ConceptDraw ...
- Decision Making | Seven Management and Planning Tools ...
- Free Decision Tree Tool
- Mind Map Office Suite Pro
- Fishbone Diagram Vs Decision Tree
- ERD | Entity Relationship Diagrams, ERD Software for Mac and Win
- Flowchart | Basic Flowchart Symbols and Meaning
- Flowchart | Flowchart Design - Symbols, Shapes, Stencils and Icons
- Flowchart | Flow Chart Symbols
- Electrical | Electrical Drawing - Wiring and Circuits Schematics
- Flowchart | Common Flowchart Symbols
- Flowchart | Common Flowchart Symbols