Decision Making

The Seven Management and Planning Tools is a set for such diagrams: Affinity Diagram, Relations Diagram, Prioritization Matrix, Root Cause Tree Diagram, Involvement Matrix, PERT Chart, Risk Diagram (PDPC).

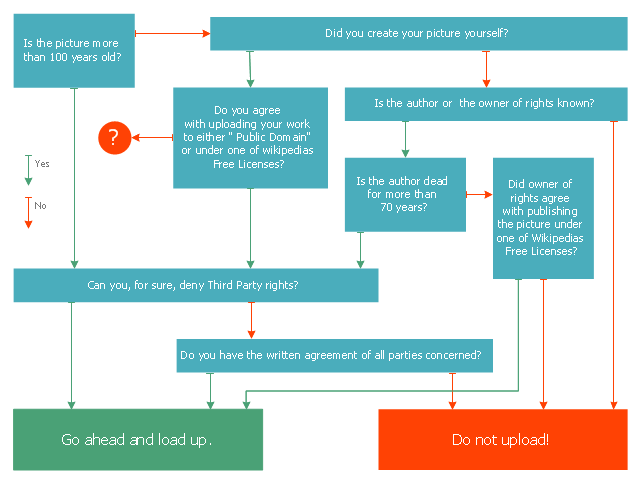
This marketing diagram sample represents decision tree. It was redesigned from the Wikimedia Commons file: Decision Tree on Uploading Imagesv2.svg.
[commons.wikimedia.org/ wiki/ File:Decision_ Tree_ on_ Uploading_ Imagesv2.svg]
"A decision tree is a decision support tool that uses a tree-like graph or model of decisions and their possible consequences, including chance event outcomes, resource costs, and utility. It is one way to display an algorithm.
Decision trees are commonly used in operations research, specifically in decision analysis, to help identify a strategy most likely to reach a goal. ...
A decision tree is a flowchart-like structure in which internal node represents test on an attribute, each branch represents outcome of test and each leaf node represents class label (decision taken after computing all attributes). A path from root to leaf represents classification rules.
In decision analysis a decision tree and the closely related influence diagram is used as a visual and analytical decision support tool, where the expected values (or expected utility) of competing alternatives are calculated.
A decision tree consists of 3 types of nodes:
(1) Decision nodes - commonly represented by squares.
(2) Chance nodes - represented by circles.
(3) End nodes - represented by triangles.
Decision trees are commonly used in operations research, specifically in decision analysis, to help identify a strategy most likely to reach a goal." [Decision tree. Wikipedia]
The marketing diagram example "Decision tree" was created using the ConceptDraw PRO diagramming and vector drawing software extended with the Marketing Diagrams solution from the Marketing area of ConceptDraw Solution Park.
Marketing flowchart
Influence Diagram

Influence diagram represents the directed acyclic graph with three types of nodes and three types of arcs that connect the nodes. Decision node is drawn as a rectangle, Uncertainty node is drawn as an oval, Value node is drawn as an octagon.
Cause and Effect Analysis

Fault Tree Diagram

Influence Diagram Software

This sample shows the Influence diagram. It is a directed acyclic graph with three types of nodes: Decision node is drawn as a rectangle, Uncertainty node is drawn as an oval, Value node is drawn as an octagon. The nodes are connected with arcs.
Decision Making Software For Small Business


CORRECTIVE ACTIONS PLANNING. Risk Diagram (PDPC)

Pyramid Diagram and Pyramid Chart

Problem solving

These tools are exemplary at organizing research, parsing complex problems, providing a structure for the details, helping managers make decisions, and organizing effective communications in a visual manner that keeps everyone involved.
PDPC

Preventive Action

Skilled use of these diagrams makes collaborative teamwork both more engaging and more effective.
Corrective Action Planning

Corrective action planning define people and groups involvement in corrective actions by roles, identify logical sequences of scheduled actions and critical path of problem solving, identify possible risks of action plan and propose preventive actions.
How To Make the Right Decision in Projects

Root Cause Tree Diagram

- Decision Analysis Decision Tree
- Decision Making | Cause and Effect Analysis | Fault Tree Diagram ...
- Decision tree diagram | Root cause analysis tree diagram - Personal ...
- Decision tree diagram | Basic Flowchart Symbols and Meaning ...
- Decision tree diagram | Marketing Charts | Marketing Diagrams ...
- Decision Tree Analysis Wiki
- Data Analysis Decision Tree
- Decision Making | Fault Tree Diagram | Cause and Effect Analysis ...
- Decision tree diagram | Cause and Effect Analysis | Decision Making ...
- Decision Tree Nodes
- Decision Making | Fault Tree Diagram | Influence Diagram Software ...
- Sample Decision Tree Template
- Decision tree diagram | Decision Making | Cause and Effect Analysis ...
- Decision tree diagram | Types of Flowcharts | Prioritization Matrix ...
- Make A Decision Tree
- Decision Tree Example
- Decision tree diagram | Organizational Structure | ConceptDraw ...
- Decision Making | Decision tree diagram | Influence Diagram ...
- Decision Tree Analysis In Project Management Ppt
- Decision tree diagram | Types of Flowcharts | Marketing Charts ...
- ERD | Entity Relationship Diagrams, ERD Software for Mac and Win
- Flowchart | Basic Flowchart Symbols and Meaning
- Flowchart | Flowchart Design - Symbols, Shapes, Stencils and Icons
- Flowchart | Flow Chart Symbols
- Electrical | Electrical Drawing - Wiring and Circuits Schematics
- Flowchart | Common Flowchart Symbols
- Flowchart | Common Flowchart Symbols