Sample Project Flowchart. Flowchart Examples

This sample was created in ConceptDraw DIAGRAM diagramming and vector drawing software using the Flowcharts solution from the Diagrams area of ConceptDraw Solution Park.

Gantt Chart Software

ConceptDraw PROJECT provides wide capabilities of importing and exporting in various formats: Microsoft Project, ConceptDraw MINDMAP , Mindjet MindManager, PDF file.
 School and Training Plans
School and Training Plans solution enhances ConceptDraw DIAGRAM functionality with extensive drawing tools, numerous samples and examples, templates and libraries of classroom design elements for quick and professional drawing the School and Training plans, School Floor plans, Classroom Layout, Classroom Seating chart, Lecture Room plans of any complexity. Each offered classroom seating chart template is a real help for builders, designers, engineers, constructors, as well as teaching personnel and other teaching-related people in drawing Classroom Seating charts and Training Room layouts with ConceptDraw DIAGRAM classroom seating chart maker.
Pie Chart Software

ConceptDraw DIAGRAM software with Pie Charts solution helps to create pie and donut charts for effective displaying proportions in statistics, business and mass media for composition comparison, i.e. for visualization of part percentage inside one total.
Flowchart on Bank. Flowchart Examples

This sample shows the Flowchart of the Subprime Mortgage Crisis. This Flowchart describes the decline in housing prices when the housing bubble burst and what it caused on the housing and financial markets. You can also see the Government and Industry responses in this crisis situation.
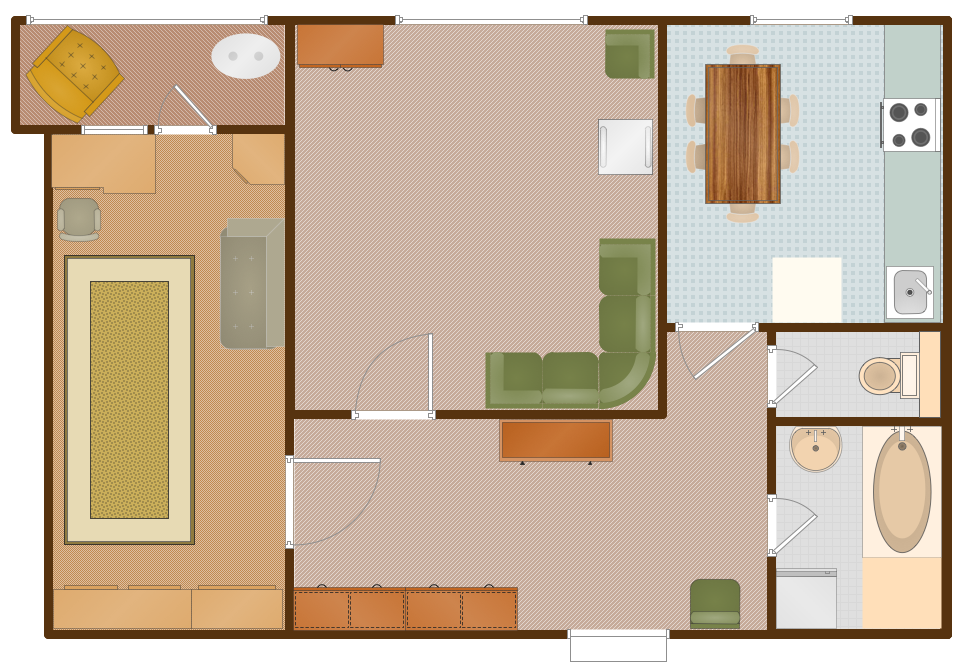
Floor Plan

Best Program to Make Flow Chart Diagrams

Start creating your own flowchart with ConceptDraw DIAGRAM and accomplish great results in the moment. This is the best program to make flow chart diagrams that gives users the ability to simply draw any type of flowchart. The fast creating visualization for the structural data with the vector stencils from object libraries by using RapidDraw technology makes ConceptDraw DIAGRAM the first program in drawing flow data.
Bar Diagram Math

Microsoft Azure

ConceptDraw DIAGRAM diagramming and vector drawing software extended with Azure Architecture Solution from the Computer and Networks area of ConceptDraw Solution Park is the best for designing various pictorial infographics, illustrations and materials showing the possibilities and work of Microsoft Azure Cloud System and Azure services.
Chart Maker for Presentations

Draw Company Structure with Organization Charting Software

Draw Company Structure Diagram - get the detailed information about the company structure and hierarchy - who execute what tasks and who is in charge at this company. This information shows the reasoning and success of business and is indispensable for investors and financial institutions.
Organizational Structure Diagram Software

Organizational Charts Solution provides a wide variety of templates and samples and large quantity of predesigned vector objects to help you design your Organizational Structure Diagrams and other business diagrams.

Emergency Plan

Horizontal Orgchart

This sample was created in ConceptDraw DIAGRAM diagramming and vector drawing software using the Organizational Charts Solution from the Management area of ConceptDraw Solution Park.
 Reflected Ceiling Plans
Reflected Ceiling Plans solution extends greatly the ConceptDraw DIAGRAM functionality with samples, templates and libraries of design elements for displaying the ceiling ideas for living room, bedroom, classroom, office, shop, restaurant, and many other premises. It is an effective tool for architects, designers, builders, electricians, and other building-related people to represent their ceiling design ideas and create Reflected Ceiling plan or Reflective Ceiling plan, showing the location of light fixtures, lighting panels, drywall or t-bar ceiling patterns, HVAC grilles or diffusers that may be suspended from the ceiling. Being professional-looking and vivid, these plans perfectly reflect your ceiling ideas and can be presented to the client, in reports, in presentations, on discussions with colleagues, or successfully published in modern print or web editions.
- UML Class Diagram Example - Social Networking Site | School and ...
- Data Flow Diagrams (DFD) | Entity-Relationship Diagram (ERD ...
- Data Flow Diagrams (DFD) | School and Training Plans | CAD ...
- ConceptDraw PRO DFD Software | Data Flow Diagrams | How to ...
- Data Flow Diagrams (DFD) | School and Training Plans | Business ...
- Data Flow Diagrams (DFD) | Microsoft Azure | ConceptDraw ...
- Class Diagram For Accounting System Of School
- Data Flow Diagrams (DFD) | Microsoft Azure | School and Training ...
- Data Flow Diagrams (DFD) | ConceptDraw Solution Park | School ...
- Data Flow Diagram For A School Library
- Draw A Dfd Of Schools Libary
- System Flow Diagram For Sports School
- Design A Data Flow Diagram For Mailing System In Your School
- Data Flow Diagram Software | Flow Chart Symbols | ATM UML ...
- ConceptDraw Solution Park | Data Flow Diagrams (DFD) | Software ...
- Entity-Relationship Diagram (ERD) | Data Flow Diagrams ...
- Dfd Diagram Of A Bank Institution
- School Management Diagram In Flowchart
- School and Training Plans | Human Resource Management ...
- School and Training Plans | Entity-Relationship Diagram (ERD ...
- ERD | Entity Relationship Diagrams, ERD Software for Mac and Win
- Flowchart | Basic Flowchart Symbols and Meaning
- Flowchart | Flowchart Design - Symbols, Shapes, Stencils and Icons
- Flowchart | Flow Chart Symbols
- Electrical | Electrical Drawing - Wiring and Circuits Schematics
- Flowchart | Common Flowchart Symbols
- Flowchart | Common Flowchart Symbols