Gane Sarson Diagram

Structured Systems Analysis and Design Method (SSADM) with ConceptDraw DIAGRAM

How to Create a Social Media DFD Flowchart

It allows companies to be more effective in timely messaging thanks to the ability for rapid response to a customer′s post in social media. This saves budget for companies who use social media for promoting and as a lead generation tool.
Object-Oriented Development (OOD) Method
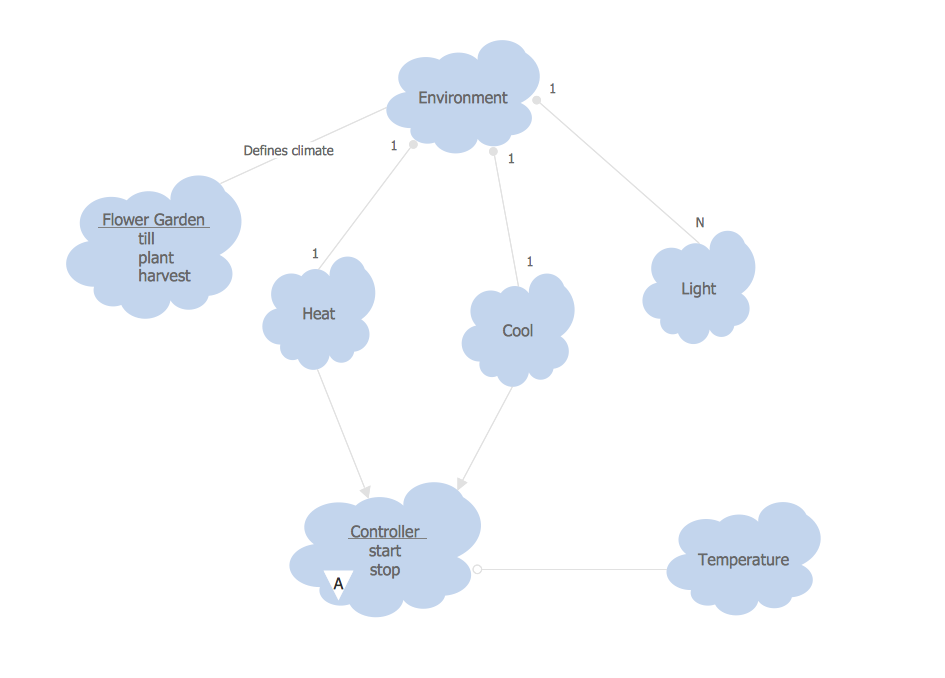
This sample was created in ConceptDraw DIAGRAM diagramming and vector drawing software using the Rapid UML Solution from the Software Development area of ConceptDraw Solution Park.
Stakeholder Management System

ConceptDraw DIAGRAM is a powerful diagramming and vector drawing software. Now, thanks to the Stakeholder Onion Diagrams Solution included to the Management Area of ConceptDraw Solution Park, ConceptDraw DIAGRAM became also unique stakeholder management system design software.
Yourdon and Coad Diagram

Onion Diagram Process Design

ConceptDraw DIAGRAM diagramming and vector drawing software supplied with Stakeholder Onion Diagrams Solution from the Management Area of ConceptDraw Solution Park is an ideal software for effective Onion diagram process design.
IDEF1X Standard

Value Stream Mapping Icons
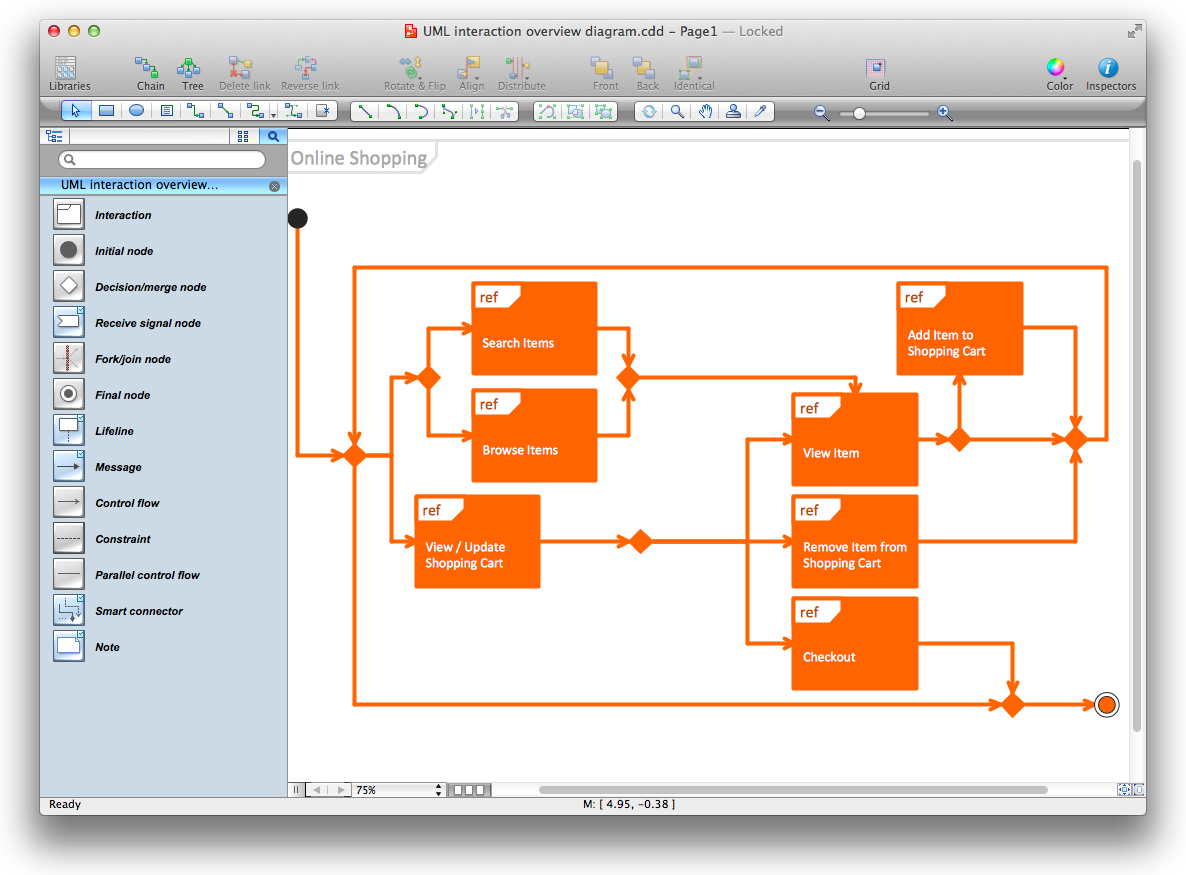
Diagramming Software for Design UML Interaction Overview Diagrams

Management Tools — Total Quality Management

 Calendars
Calendars solution extends ConceptDraw DIAGRAM software with templates, samples and library of vector stencils for drawing the business calendars and schedules.
Online Flow Chart

Process Mapping
Visualize Stakeholder Analysis

Use the ConceptDraw DIAGRAM diagramming and vector drawing software enhanced with powerful tools of Stakeholder Onion Diagrams Solution from the Management Area of ConceptDraw Solution Park to easy and effectively visualize stakeholder analysis.
- Data Flow Diagram For Hospital Appointment System
- Data Flow Diagram For Appointment Schedule
- Data Flow Diagram For Online Doctor Appointment
- Process Flow Diagram Of Appointment Scheduling
- Data Flow Diagrams | Business Process Mapping | Dfd Of Online ...
- Gane Sarson Diagram | Calendars | Dfd Diagram Online ...
- Data Flow Diagram For Online Doctor Appointment System
- Fishbone Diagram Problem Solving | Data Flow Diagram Of Clinic
- Dfd Diagram For Hospital With Appointments
- Dfd For Online Hospital Appointment System
- Appointment Process Through Flow Chart
- Process Flowchart | Taxi Service Data Flow Diagram DFD Example ...
- Business Process Mapping | Doctor Appointment Dfd
- Data Flow Diagrams (DFD) | Business diagrams & Org Charts with ...
- Data Flow Diagram For Clinic Appointment
- Last resort hotel book room process - DFD | Proposed Patient ...
- Data Flow Diagram | Stakeholder Management System | Example of ...
- Data Flow Diagram For Appointment Booking App
- Application For Apointment At Hospital Dataflow Diagram
- Sales Process Flowchart . Flowchart Examples
- ERD | Entity Relationship Diagrams, ERD Software for Mac and Win
- Flowchart | Basic Flowchart Symbols and Meaning
- Flowchart | Flowchart Design - Symbols, Shapes, Stencils and Icons
- Flowchart | Flow Chart Symbols
- Electrical | Electrical Drawing - Wiring and Circuits Schematics
- Flowchart | Common Flowchart Symbols
- Flowchart | Common Flowchart Symbols