HelpDesk
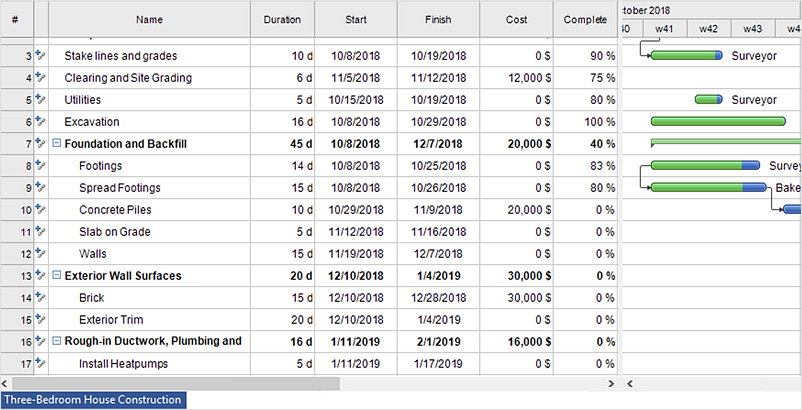
How to Import Project Data From MS Excel File
You can import information into the project from MS Excel workbook using the entered fields - fields in which you can enter or edit information as opposed to calculated fields.Structured Systems Analysis and Design Method (SSADM) with ConceptDraw DIAGRAM
Structured Systems Analysis and Design Method SSADM is the method which is used at projecting and analysis of information systems. SSADM is based on the data flow diagrams. At the description of data flows out of the system and into the system DFD, which denote boundaries of the system, are used.DFD Library — Design elements
Three DFD libraries, 49 vector shapes. Use these DFD symbol libraries to design the process-oriented models, data-oriented models, data flowcharts, data process diagrams, structured analysis diagrams, and information flow diagrams.Data Flow Diagram Model
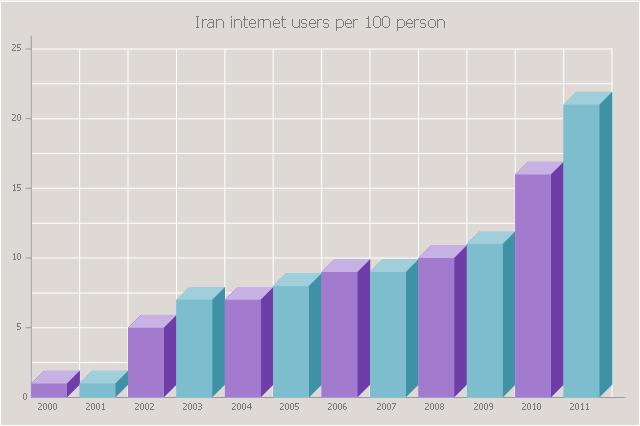
The DFD (Yourdon and Coad notation) example "Model of small traditional production enterprise" below was created using the ConceptDraw DIAGRAM diagramming and vector drawing software extended with the Data Flow Diagrams solution from the Software Development area of ConceptDraw Solution Park.The 3D vertical bar graph sample shows the Iran internet users per 100 person from 2000 to 2011. It was designed on the base of the Commons Wikimedia file: Iran internet users per 100 person.png.
[commons.wikimedia.org/ wiki/ File:Iran_ internet_ users_ per_ 100_ person.png]
This file is licensed under the Creative Commons Attribution-Share Alike 3.0 Unported license. [creativecommons.org/ licenses/ by-sa/ 3.0/ deed.en]
The data source is World Bank: [data.worldbank.org/ country/ iran-islamic-republic]
"In 1993 Iran became the second country in the Middle East to be connected to the Internet, and since then the government has made significant efforts to improve the nation's ICT infrastructure. Iran's national Internet connectivity infrastructure is based on two major networks: the public switched telephone network (PSTN) and the public data network. The PSTN provides a connection for end-users to Internet service providers (ISPs) over mostly digital lines and supports modem-based connections. The Data Communication Company of Iran (DCI), a subsidiary of TCI, operates the public data network." [Internet in Iran. Wikipedia]
The 3D column chart example "Iran internet users per 100 person" was created using the ConceptDraw PRO diagramming and vector drawing software extended with the Bar Graphs solution from the Graphs and Charts area of ConceptDraw Solution Park.
"General packet radio service (GPRS) is a packet oriented mobile data service on the 2G and 3G cellular communication system's global system for mobile communications (GSM). GPRS was originally standardized by European Telecommunications Standards Institute (ETSI) in response to the earlier CDPD and i-mode packet-switched cellular technologies. It is now maintained by the 3rd Generation Partnership Project (3GPP).
GPRS usage is typically charged based on volume of data transferred, contrasting with circuit switched data, which is usually billed per minute of connection time. Usage above the bundle cap is either charged per megabyte or disallowed.
GPRS is a best-effort service, implying variable throughput and latency that depend on the number of other users sharing the service concurrently, as opposed to circuit switching, where a certain quality of service (QoS) is guaranteed during the connection. In 2G systems, GPRS provides data rates of 56–114 kbit/ second. 2G cellular technology combined with GPRS is sometimes described as 2.5G, that is, a technology between the second (2G) and third (3G) generations of mobile telephony. It provides moderate-speed data transfer, by using unused time division multiple access (TDMA) channels in, for example, the GSM system. GPRS is integrated into GSM Release 97 and newer releases." [General Packet Radio Service. Wikipedia]
This GPRS network diagram example was created using the ConceptDraw PRO diagramming and vector drawing software extended with the Telecommunication Network Diagrams solution from the Computer and Networks area of ConceptDraw Solution Park.
"A data flow diagram (DFD) is a graphical representation of the "flow" of data through an information system. It differs from the flowchart as it shows the data flow instead of the control flow of the program. A data flow diagram can also be used for the visualization of data processing (structured design). Data flow diagrams were invented by Larry Constantine, the original developer of structured design, based on Martin and Estrin's "data flow graph" model of computation.
It is common practice to draw a context-level Data flow diagram first which shows the interaction between the system and outside entities. The DFD is designed to show how a system is divided into smaller portions and to highlight the flow of data between those parts. This context-level Data flow diagram is then "exploded" to show more detail of the system being modeled" [Data model. Wikipedia]
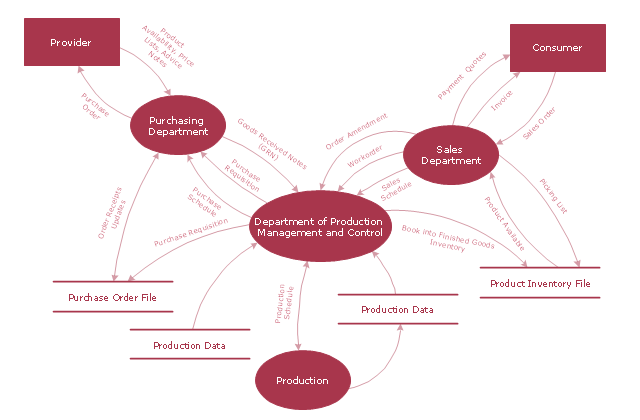
The DFD (Yourdon and Coad notation) example "Model of small traditional production enterprise" was created using the ConceptDraw PRO diagramming and vector drawing software extended with the Data Flow Diagrams solution from the Software Development area of ConceptDraw Solution Park.
Flowchart Symbols Accounting. Activity-based costing (ABC) flowchart
This flow chart example represent activity-based costing flowchart (ABC flowchart): resource-catagories, resource cost drivers, activities, activity cost drivers, cost objects, direct materials, direct labour. This sort of accounting flowcharts intended to explain how costs distributed between company units and departments. There is only way to clearly explain activity-based cost distribution - create cost diagram demonstrating cost distribution relations and logics. ConceptDraw DIAGRAM is special software with accounting flowchart symbols and flowchart stencils for effective drawing activity-based cost flowcharts (ABC-flowcharts).HelpDesk
How to Use ConceptDraw Dashboard for Facebook on Mac
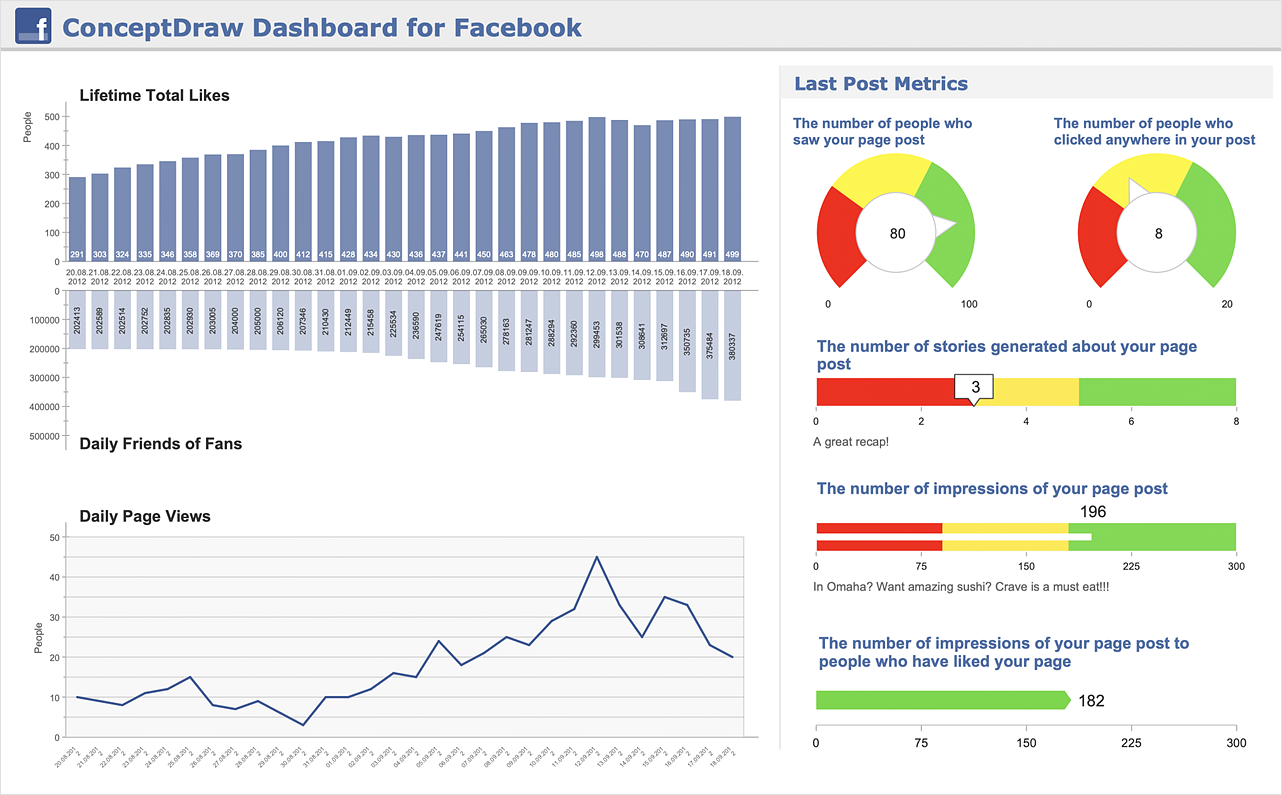
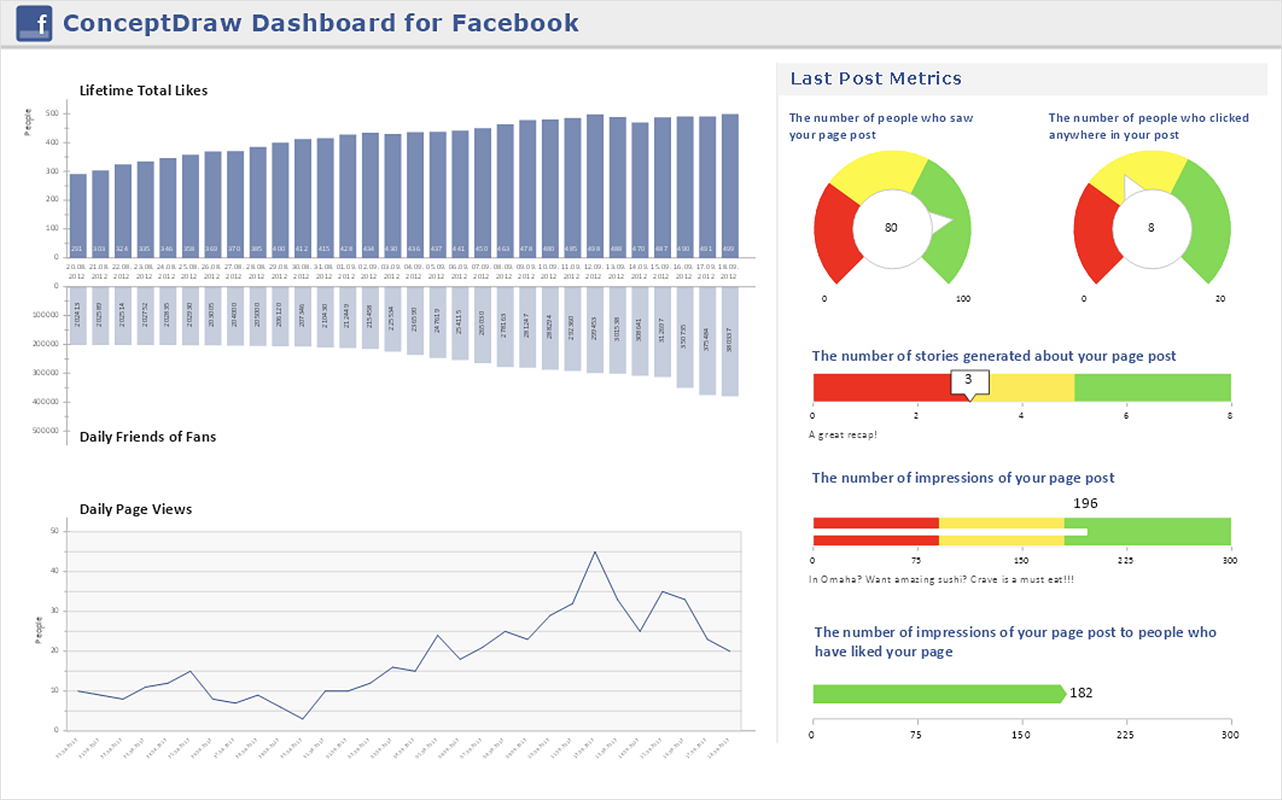
The ConceptDraw Dashboard for Facebook Solution is a visual dashboard that visualizes lifetime total Likes, daily Friends of Fans, and daily Page views based on the information exported from your Facebook Page.Affinity Diagram
The affinity diagram is a business tool used to organize ideas and data. It is one of the Seven Management and Planning Tools. But how design the Affinity Diagram quick and easy? ConceptDraw DIAGRAM diagramming and vector drawing software offers the Seven Management and Planning Tools Solution from the Management Area.Venn Diagram Examples for Problem Solving
In the Venn Diagrams solution, there are the pre-made examples that can be always used for making the unique, great looking diagrams, such as the 2-set Venn ones of any needed colour, the 3-set one, the 4-set ones and the 5-set ones. Having the already previously created samples of the Venn diagrams can help any ConceptDraw DIAGRAM user make it possible to make the needed drawing within only a few minutes by editing the existing ones.HelpDesk
How to Use ConceptDraw Dashboard for Facebook on PC
The ConceptDraw Dashboard for Facebook Solution is a visual dashboard that visualizes lifetime total Likes, daily Friends of Fans, and daily Page views based on the information exported from your Facebook Page.- Exclusive (XOR), data - based
- data , based , data based , Data Based
- Gateways BPMN 1.2 - Vector stencils library
- Data Flow Diagram Model | DFD - Model of small traditional ...
- Data flow Model Diagram
- Design elements - Gateways and artifacts BPMN 1.2 | Design ...
- Gateways BPMN 1.2 - Vector stencils library | Gateways - Vector ...
- Visio Files and ConceptDraw | Process Flowchart | Data Flow ...
- Exclusive (XOR), event - based
- Gateways - Vector stencils library | Gateways BPMN 1.2 - Vector ...
- Data Flow Diagrams
- Context Diagram Template | DFD Library System | Data Flow ...
- Pyramid Diagram | Pyramid Diagram | 4 Level pyramid model ...
- Events BPMN 1.2 - Vector stencils library | Expanded objects BPMN ...
- 3 level pyramid model diagram of information systems types | 5 level ...
- Expanded objects BPMN 1.2 - Vector stencils library | Expanded ...
- Parallel Event Based Gateway
- Design elements - Expanded objects BPMN 2.0 | Design elements ...
- Example of DFD for Online Store ( Data Flow Diagram). DFD ...
- Event Based Gateway
- ERD | Entity Relationship Diagrams, ERD Software for Mac and Win
- Flowchart | Basic Flowchart Symbols and Meaning
- Flowchart | Flowchart Design - Symbols, Shapes, Stencils and Icons
- Flowchart | Flow Chart Symbols
- Electrical | Electrical Drawing - Wiring and Circuits Schematics
- Flowchart | Common Flowchart Symbols
- Flowchart | Common Flowchart Symbols
