Sales Dashboard - Access Anywhere
 Entity-Relationship Diagram (ERD)
An Entity-Relationship Diagram (ERD) is a visual presentation of entities and relationships. That type of diagrams is often used in the semi-structured or unstructured data in databases and information systems. At first glance ERD is similar to a flowch
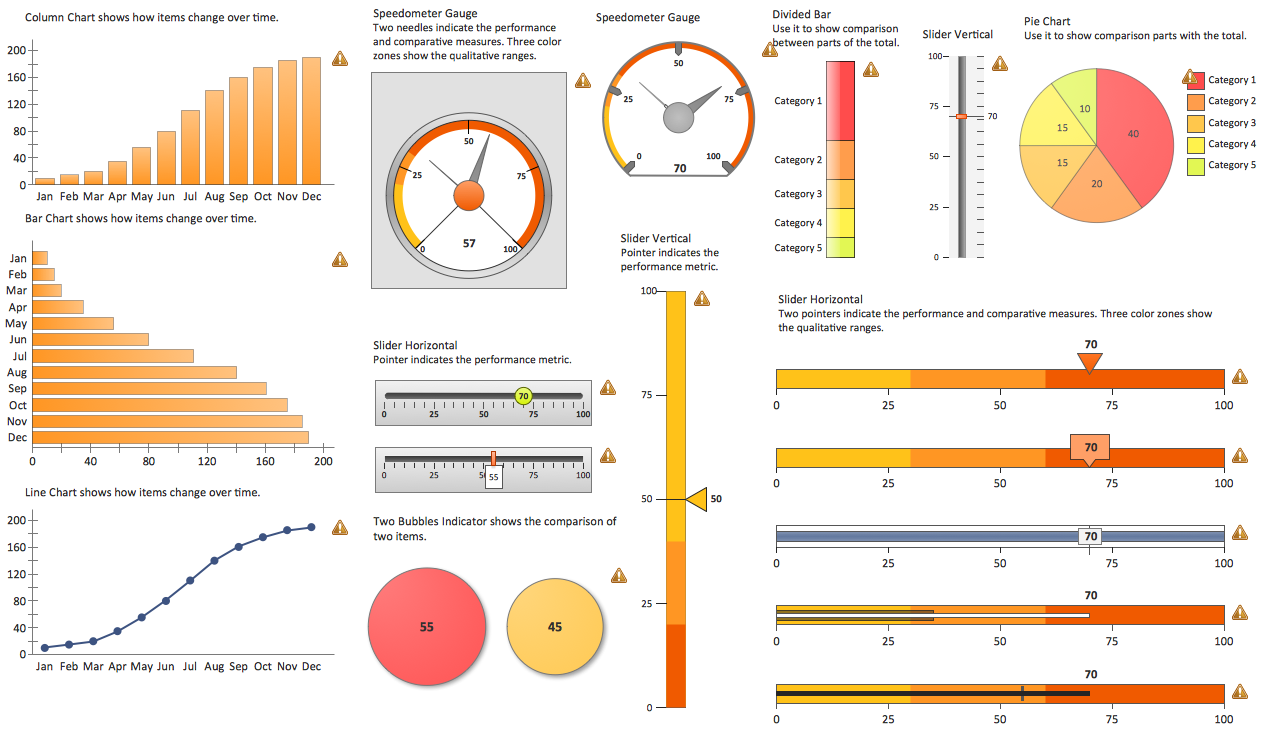
 Meter Dashboard
Meter dashboard solution extends ConceptDraw DIAGRAM software with templates, samples and vector stencils library with meter indicators for drawing visual dashboards showing quantitative data.
KPI Dashboard

Dashboard

 Chen Notation
The Chen Notation solution extends ConceptDraw DIAGRAM software with rich collection of ERD samples and selection of special Chen's notation icons for effective database design, data modeling, and visual representation of relationships between the entities on the ER diagrams designed with Chen notation.
 AWS Architecture Diagrams
AWS Architecture Diagrams with powerful drawing tools and numerous predesigned Amazon icons and AWS simple icons is the best for creation the AWS Architecture Diagrams, describing the use of Amazon Web Services or Amazon Cloud Services, their application for development and implementation the systems running on the AWS infrastructure. The multifarious samples give you the good understanding of AWS platform, its structure, services, resources and features, wide opportunities, advantages and benefits from their use; solution’s templates are essential and helpful when designing, description and implementing the AWS infrastructure-based systems. Use them in technical documentation, advertising and marketing materials, in specifications, presentation slides, whitepapers, datasheets, posters, etc.
Reporting & Data Visualization
 Object-Role Modeling (ORM) Diagrams
Object-role Modeling (ORM) Diagram solution with powerful vector diagramming and data modeling tools, large quantity of specially developed samples and examples, and rich variety of vector objects corresponding to common ORM notation, ideally suits for developing the comprehensive, clear and visual Object-role Modeling (ORM) diagrams and schematics, understandable for all interested people from the different fields and business directions, for designing the ORM models, and demonstrating advantages from the use of ORM and its notation. It is intended for software developers and computer engineers, specialists in a field of Object-oriented programming (OOP), database architects, web-application constructors and developers, etc.
- Dashboard Database Design
- Data structure diagram with ConceptDraw PRO | Software ...
- Design elements - Sales workflow | Sales Database Design
- Performance Indicators | Design elements - Sales dashboard | How ...
- Status Dashboard | Design elements - Composition charts and ...
- Design elements - Composition charts and indicators | Basic Pie ...
- Meter indicators 2 - Vector stencils library | Design elements - Meter ...
- Activity Diagram For Dashboard
- ConceptDraw Dashboard for Facebook | UML Use Case Diagram ...
- Balanced Scorecard Software | ConceptDraw Solution Park | Design ...
- ERD | Entity Relationship Diagrams, ERD Software for Mac and Win
- Flowchart | Basic Flowchart Symbols and Meaning
- Flowchart | Flowchart Design - Symbols, Shapes, Stencils and Icons
- Flowchart | Flow Chart Symbols
- Electrical | Electrical Drawing - Wiring and Circuits Schematics
- Flowchart | Common Flowchart Symbols
- Flowchart | Common Flowchart Symbols