This site uses cookies. By continuing to browse the ConceptDraw site you are agreeing to our Use of Site Cookies.

Process Flowchart

ConceptDraw is Professional business process mapping software for making process flow diagram, workflow diagram, general flowcharts and technical illustrations for business documents. It is includes rich examples, templates, process flowchart symbols. ConceptDraw flowchart maker allows you to easier create a process flowchart. Use a variety of drawing tools, smart connectors, flowchart symbols and shape libraries to create flowcharts of complex processes, process flow diagrams, procedures and information exchange.
How To Create a Process Flow Chart (business process modelling techniques)

Onion Diagram Maker

The onion diagram is a type of diagram which shows the dependencies among parts of an organization or process. The items are displayed at the concentric circles, where the items at the bigger rings depend on the items at the smaller rings.
ConceptDraw DIAGRAM diagramming and vector drawing software extended with Stakeholder Onion Diagrams Solution from the Management Area of ConceptDraw Solution Park is a professional Onion Diagram Maker.

ConceptDraw DIAGRAM DFD Software

Our DFD software ConceptDraw DIAGRAM allows you to quickly create DFD with data storages, external entities, functional transforms, data flows, as well as control transforms and signals. DFD program ConceptDraw DIAGRAM has hundreds of templates, and a wide range of libraries with all nesassary ready-made drag-and-drop.

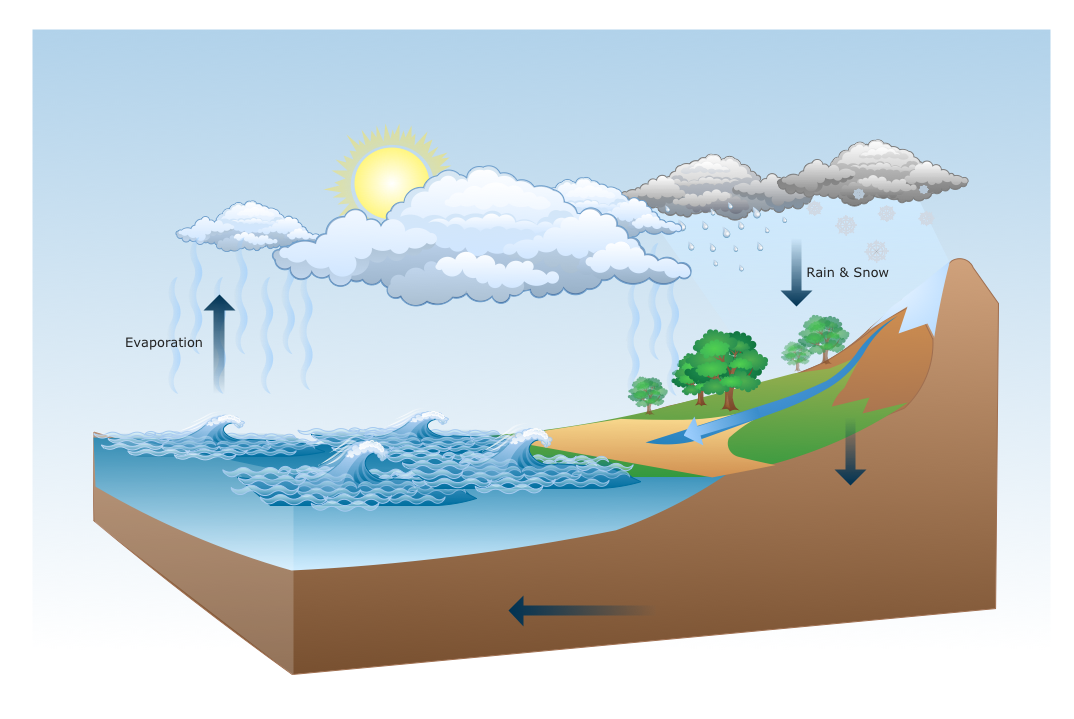
Drawing a Nature Scene

ConceptDraw DIAGRAM is a drawings software for creating Nature scenes. Nature solution from ConceptDraw Solution Park expands this software with a new library that contains 17 vector objects and samples illustration files.

Data Flow Diagram Software

When studying a business process or system that involves the transfer of data, it is common to use a data flow diagram (DFD) to visualize how that data is processed. While initially used exclusively in regards to the flow of data through a computer system, DFDs are now employed as a business modelling tool, describing business events and interactions, or physical systems involving data storage and transfer.
ConceptDraw DIAGRAM is a powerful Data Flow Diagram Software thanks to the Data Flow Diagrams solution from the Software Development area of ConceptDraw Solution Park.
You can use the predesigned DFD vector objects that are grouped in 3 libraries of Data Flow Diagrams solution: Data Flow Diagrams Library; Gane-Sarson Notation Library; Yourdon and Coad Notation Library.

Example of DFD for Online Store (Data Flow Diagram)

Data flow diagrams (DFDs) reveal relationships among and between the various components in a program or system. DFDs are an important technique for modeling a system’s high-level detail by showing how input data is transformed to output results through a sequence of functional transformations.
Example of DFD for Online Store shows the Data Flow Diagram for online store and interactions between the Visitors, Customers and Sellers, as well as Website Information and User databases.
Steps to Creating a Sales Process Flow Chart

Flow Diagram Software

ConceptDraw is a professional Process Flow Diagram software. The basic set of the stencils libraries, samples and templates allows you to draw any type of flowchart. Flowcharts give to users the ability to represent structural data visually. One can draw own flowchart in seconds by using RapidDraw technology.

Best Program to Create a Fowchart

ConceptDraw - feature-rich flowchart software allows you create professional looking flowcharts.

ConceptDraw DIAGRAM ER Diagram Tool

ER-diagram is a tool used for database modeling which allows to determine data and relationships among the data. These diagrams help to detail data storages and to document all the properties of designed system. ER-diagram contains entities, attributes of the entities and the relationships between them. Chen’s notation and Crow’s foot notation are commonly used to represent elements in ER-model. To create such diagram you should use specific software, such as Entity-Relationship Diagram solution for ConceptDraw DIAGRAM.
ConceptDraw ER Diagram Tool works across any platform, meaning you never have to worry about compatibility again. ConceptDraw DIAGRAM allows you to make Entity-Relationship Diagram (ERD) on PC or macOS operating systems.

Entity Relationship Diagram Symbols

Creating an entity-relationship (ER) model is to visually represent the structure of a business database, where data equates to entities (or objects) that are linked by defined relationships expressing dependencies and requirements. By nature it is an abstract visualization, the first step in the design process towards creating a logical and functional database.
ERD symbols used for professional ERD drawing are collected in libraries from the Entity-Relationship Diagram (ERD) solution for ConceptDraw DIAGRAM.