 Business Process Diagrams
Business Process Diagrams solution extends the ConceptDraw PRO BPM software with RapidDraw interface, templates, samples and numerous libraries based on the BPMN 1.2 and BPMN 2.0 standards, which give you the possibility to visualize equally easy simple and complex processes, to design business models, to quickly develop and document in details any business processes on the stages of project’s planning and implementation.
How To Create a Workflow Diagram

The fastest way to create a workflow diagram is using pre-designed workflow template. ConceptDraw PRO with the Workflow Diagrams solution delivers rich set of workflow diagram templates you may start from.
This marketing diagram sample illustrates leaky bucket model.
"The leaky bucket theory. The leaky bucket theory is the model that seeks to describe the process of customer gain and loss, otherwise known as customer churn. Customer retention is one of the key concepts in relationship marketing. Most companies concentrate on recruiting new customers to replace customers who move on, rather than seeking to retain customers." [Blythe J. Key Concepts in Marketing. 2009. knowledge.sagepub.com/ view/ key-concepts-in-marketing/ n5.xml]
"Customer attrition, also known as customer churn, customer turnover, or customer defection, is the loss of clients or customers.
Banks, telephone service companies, Internet service providers, pay TV companies, insurance firms, and alarm monitoring services, often use customer attrition analysis and customer attrition rates as one of their key business metrics (along with cash flow, EBITDA, etc.) because the "...cost of retaining an existing customer is far less than acquiring a new one." Companies from these sectors often have customer service branches which attempt to win back defecting clients, because recovered long-term customers can be worth much more to a company than newly recruited clients." [Customer attrition. Wikipedia]
The chart example "Leaky bucket diagram" was created using the ConceptDraw PRO diagramming and vector drawing software extended with the Marketing Diagrams solution from the Marketing area of ConceptDraw Solution Park.
Marketing chart

TQM Diagram Example

"Dimensions of service quality.
A customer's expectation of a particular service is determined by factors such as recommendations, personal needs and past experiences. The expected service and the perceived service sometimes may not be equal, thus leaving a gap. The service quality model or the ‘GAP model’ developed by a group of authors- Parasuraman, Zeithaml and Berry at Texas and North Carolina in 1985 , highlights the main requirements for delivering high service quality. It identifies five ‘gaps’ that cause unsuccessful delivery. Customers generally have a tendency to compare the service they 'experience' with the service they 'expect' . If the experience does not match the expectation , there arises a gap. Ten determinants that may influence the appearance of a gap were described by Parasuraman, Zeithaml and Berry. in the SERVQUAL model: reliability, responsiveness, competence, access, courtesy, communication, credibility, security, understanding the customer and tangibles.
Later, the determinants were reduced to five: tangibles; reliability; responsiveness; service assurance and empathy in the so called RATER model." [Service quality. Wikipedia]
The block diagram example "Gap model of service quality" was created using the ConceptDraw PRO diagramming and vector drawing software extended with the Block Diagrams solution from the area "What is a Diagram" of ConceptDraw Solution Park.
Block diagram

HelpDesk
How to Create an Interactive Voice Response (IVR) Diagram in ConceptDraw PRO
 diagram")
Workflow Process Example

Flowchart Components

Business Process Modeling Notation

Business Process Diagrams Cross-Functional-Flowcharts, Workflows, Process Charts, IDEF0 and IDEF2, Timeline, Calendars, Gantt Charts, Business Process Modeling, Audit and Opportunity Flowcharts and Mind Maps (presentations, meeting agendas).
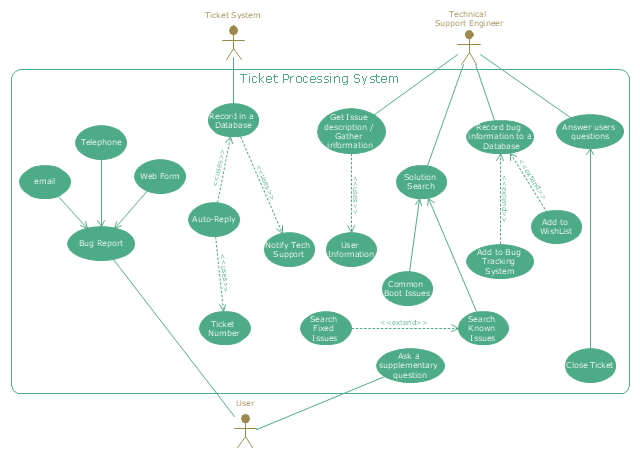
"An example scenario is presented to demonstrate how a common issue tracking system would work:
(1) A customer service technician receives a telephone call, email, or other communication from a customer about a problem. Some applications provide built-in messaging system and automatic error reporting from exception handling blocks.
(2) The technician verifies that the problem is real, and not just perceived. The technician will also ensure that enough information about the problem is obtained from the customer. This information generally includes the environment of the customer, when and how the issue occurs, and all other relevant circumstances.
(3) The technician creates the issue in the system, entering all relevant data, as provided by the customer.
(4) As work is done on that issue, the system is updated with new data by the technician. Any attempt at fixing the problem should be noted in the issue system. Ticket status most likely will be changed from open to pending.
(5) After the issue has been fully addressed, it is marked as resolved in the issue tracking system.
If the problem is not fully resolved, the ticket will be reopened once the technician receives new information from the customer. A Run Book Automation process that implements best practices for these workflows and increases IT personnel effectiveness is becoming very common." [Issue tracking system. Wikipedia]
The UML use case diagram example "Ticket processing system" was created using the ConceptDraw PRO diagramming and vector drawing software extended with the Rapid UML solution from the Software Development area of ConceptDraw Solution Park.
UML use case diagram
UML Class Diagram Tutorial

Process Flowchart


SWOT matrix template

Workflow Diagram Examples

Create Workflow Diagram

- Customer Service Workflow Diagram
- Customer Service Tree Diagram
- Customer Service Flow Chart Template
- IVR customer service hotline diagram | Six Markets Model Chart ...
- Fishbone Diagram For Customer Service
- IVR customer service hotline diagram
- IVR customer service hotline diagram | IVR services diagram | How ...
- Service -goods continuum diagram | Process Flowchart | How To ...
- Block diagram - Sources of customer satisfaction | IVR customer ...
- Draw A Flowchart Showing The Chain Of Customer Service In Your
- Customer Complaints To Customer Service In Bank Usecase Diagram
- Block diagram - Gap model of service quality | Process Flowchart ...
- Customer Service Decision Tree
- What is IVR? | IVR customer service hotline diagram | Interactive ...
- Customer Service Quality System Examples
- Customer Service Flowchart Templates
- IVR customer service hotline diagram | Organic Chemistry Symbols ...
- Customer types matrix | Response to Customer Negative Feedback ...
- Interactive Voice Response Diagrams | How to Create an Interactive ...
- Customer Service Flowchart Examples
- ERD | Entity Relationship Diagrams, ERD Software for Mac and Win
- Flowchart | Basic Flowchart Symbols and Meaning
- Flowchart | Flowchart Design - Symbols, Shapes, Stencils and Icons
- Flowchart | Flow Chart Symbols
- Electrical | Electrical Drawing - Wiring and Circuits Schematics
- Flowchart | Common Flowchart Symbols
- Flowchart | Common Flowchart Symbols