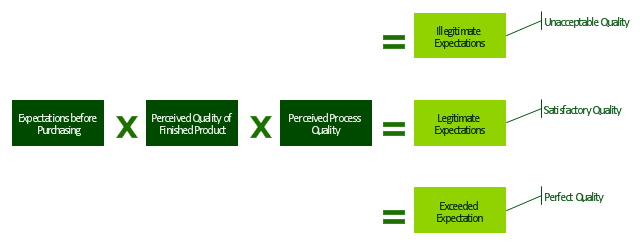
"Customer satisfaction is a term frequently used in marketing. It is a measure of how products and services supplied by a company meet or surpass customer expectation. Customer satisfaction is defined as "the number of customers, or percentage of total customers, whose reported experience with a firm, its products, or its services (ratings) exceeds specified satisfaction goals." ...
It is seen as a key performance indicator within business and is often part of a Balanced Scorecard. In a competitive marketplace where businesses compete for customers, customer satisfaction is seen as a key differentiator and increasingly has become a key element of business strategy." [Customer satisfaction. Wikipedia]
The block diagram example "Sources of customer satisfaction" was created using the ConceptDraw PRO diagramming and vector drawing software extended with the Block Diagrams solution from the area "What is a Diagram" of ConceptDraw Solution Park.
Block diagram
 Marketing Diagrams
Marketing Diagrams solution extends ConceptDraw DIAGRAM diagramming software with abundance of samples, templates and vector design elements intended for easy graphical visualization and drawing different types of Marketing diagrams and graphs, including Branding Strategies Diagram, Five Forces Model Diagram, Decision Tree Diagram, Puzzle Diagram, Step Diagram, Process Chart, Strategy Map, Funnel Diagram, Value Chain Diagram, Ladder of Customer Loyalty Diagram, Leaky Bucket Diagram, Promotional Mix Diagram, Service-Goods Continuum Diagram, Six Markets Model Diagram, Sources of Customer Satisfaction Diagram, etc. Analyze effectively the marketing activity of your company and apply the optimal marketing methods with ConceptDraw DIAGRAM software.
 Block Diagrams
Block diagrams solution extends ConceptDraw DIAGRAM software with templates, samples and libraries of vector stencils for drawing the block diagrams.
Best Value — Total Quality Management

Organizational Structure Total Quality Management

A Study of the Business Value of Total Quality Management
 Marketing Area
The solutions from Marketing area of ConceptDraw Solution Park collect templates, samples and libraries of vector stencils for drawing the marketing diagrams and mind maps.
Quality Management System
HelpDesk
How to Draw a Block Diagram

 Sales Dashboard
Sales Dashboard solution extends ConceptDraw DIAGRAM software with templates, samples and library of vector stencils for drawing the visual dashboards of sale metrics and key performance indicators (KPI).
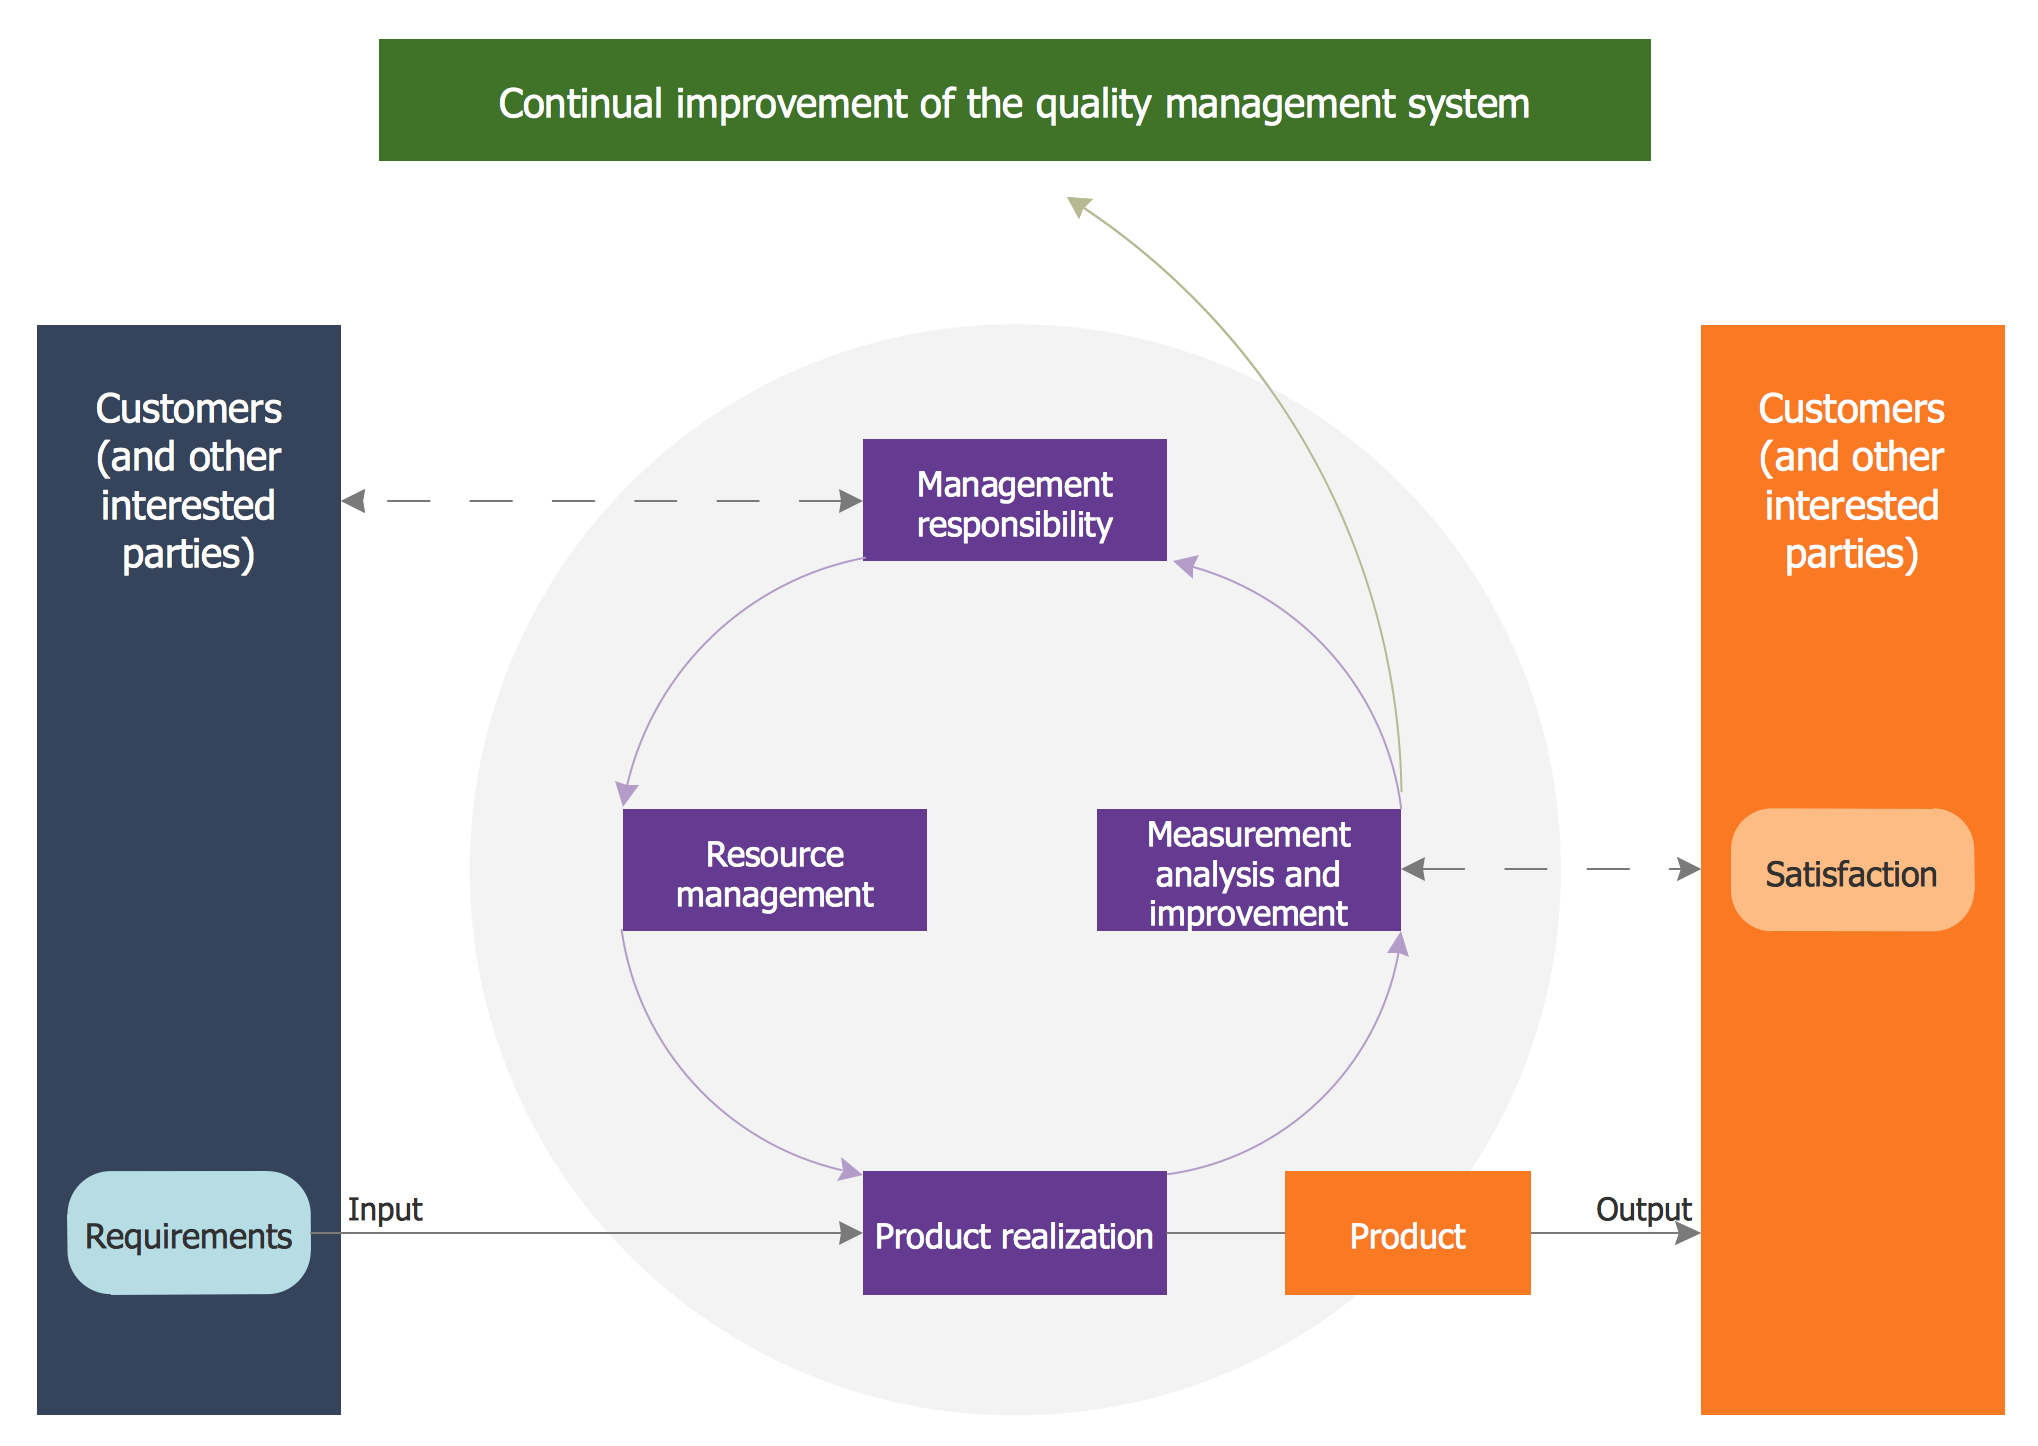
This ring chart sample was redesigned from the Wikipedia file: Virtuous circle in management.svg.
"An example of the use of a virtuous circle in management."
[en.wikipedia.org/ wiki/ File:Virtuous_ circle_ in_ management.svg]
"A virtuous circle and a vicious circle (also referred to as virtuous cycle and vicious cycle) are economic terms. They refer to a complex chain of events that reinforces itself through a feedback loop. A virtuous circle has favorable results, while a vicious circle has detrimental results.
Both circles are complexes of events with no tendency towards equilibrium (at least in the short run). Both systems of events have feedback loops in which each iteration of the cycle reinforces the previous one (positive feedback). These cycles will continue in the direction of their momentum until an external factor intervenes and breaks the cycle. The prefix "hyper-" is sometimes used to describe these cycles if they are extreme. The best-known example of a vicious circle is hyperinflation. ...
Example in management.
Virtuous circle.
An employer's investment in his employees’ ability to provide superior service to customers can be seen as a virtuous circle. Effort spent in selecting and training employees and creating a corporate culture in which they are empowered can lead to increased employee satisfaction and employee competence. This can result in superior service delivery and customer satisfaction. This in turn will create customer loyalty, improved sales levels, and higher profit margins. Some of these profits can be reinvested in employee development, thereby initiating another iteration of a virtuous cycle." [en.wikipedia.org/ wiki/ Virtuous_ circle_ and_ vicious_ circle]
The ring chart example "Virtuous circle (management)" was created using the ConceptDraw PRO diagramming and vector drawing software extended with the Target and Circular Diagrams solution from the Marketing area of ConceptDraw Solution Park.
www.conceptdraw.com/ solution-park/ marketing-target-and-circular-diagrams
Ring chart
---ring-chart.png--diagram-flowchart-example.png)
Block Diagram Creator
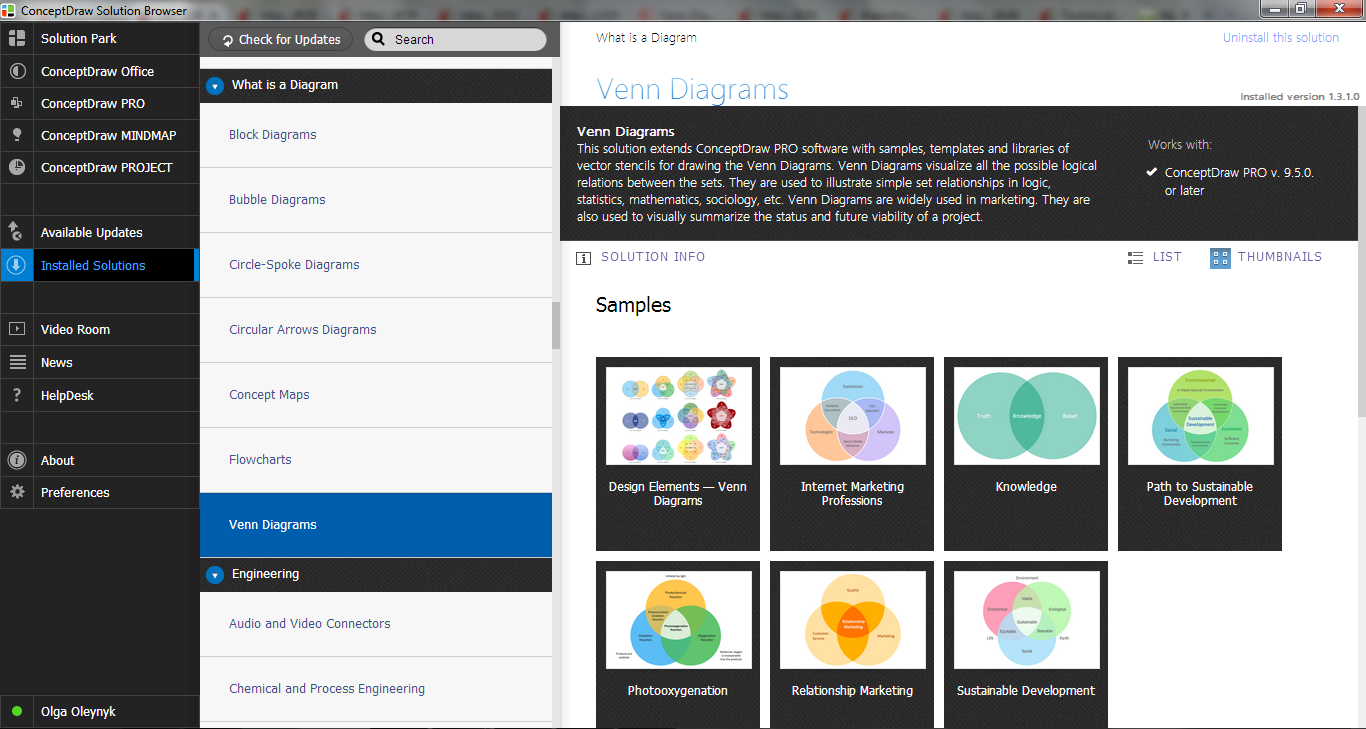
Venn Diagram Examples
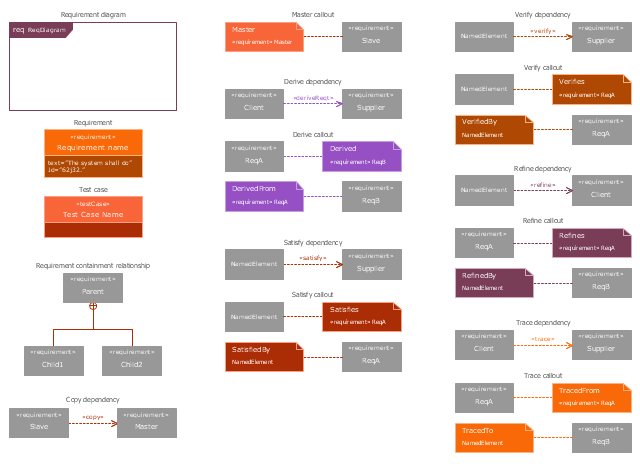
The vector stencils library "Requirement diagram" contains 21 SysML symbols.
Use it to design your requirement diagrams using ConceptDraw PRO diagramming and vector drawing software.
"A requirement specifies a capability or condition that must (or should) be satisfied. A requirement may specify a function that a system must perform or a performance condition a system must achieve. SysML provides modeling constructs to represent text-based requirements and relate them to other modeling elements. The requirements diagram described in this clause can depict the requirements in graphical, tabular, or tree structure format. A requirement can also appear on other diagrams to show its relationship to other modeling elements. The requirements modeling constructs are intended to provide a bridge between traditional requirements management tools and the other SysML models.
A requirement is defined as a stereotype of UML Class subject to a set of constraints. A standard requirement includes properties to specify its unique identifier and text requirement. Additional properties such as verification status, can be specified by the user.
Several requirements relationships are specified that enable the modeler to relate requirements to other requirements as well as to other model elements. These include relationships for defining a requirements hierarchy, deriving requirements, satisfying requirements, verifying requirements, and refining requirements." [www.omg.org/ spec/ SysML/ 1.3/ PDF]
The SysML shapes example "Design elements - Requirement diagram" is included in the SysML solution from the Software Development area of ConceptDraw Solution Park.
SysML requirement diagram symbols
Examples of Flowcharts, Org Charts and More


- Block diagram - Sources of customer satisfaction | Virtuous circle ...
- Block diagram - Sources of customer satisfaction | Block Diagram ...
- Block diagram - Sources of customer satisfaction | IVR customer ...
- Block diagram - Sources of customer satisfaction
- Concept Map For Customer Satisfaction
- Customer Marketing Diagram
- Ladder of customer loyalty diagram | Loyalty - Arrow circle diagram ...
- Block diagram - Porter's five forces model | Process Flowchart ...
- Customer Circle Diagram
- Social Media Response | Block Diagram Tutorial Customer Service
- Ladder of customer loyalty diagram | Marketing Diagrams ...
- Customer Loyalty Diagram Template
- Customer types matrix | Response to Customer Negative Feedback ...
- Leaky bucket diagram | Circular Diagram | Customer Retention ...
- Block diagram - Customer decision making | Rational Decision ...
- Design Elements Marketing Customer Loyalty Diagram
- Positive Customer Feedback | Bank Customer Positive Feedback ...
- Diagram Of Customer Market
- Customer Support System Class Diagram Diagram
- Fishbone Diagram For Customer Service
- ERD | Entity Relationship Diagrams, ERD Software for Mac and Win
- Flowchart | Basic Flowchart Symbols and Meaning
- Flowchart | Flowchart Design - Symbols, Shapes, Stencils and Icons
- Flowchart | Flow Chart Symbols
- Electrical | Electrical Drawing - Wiring and Circuits Schematics
- Flowchart | Common Flowchart Symbols
- Flowchart | Common Flowchart Symbols