Critical Path Method in ConceptDraw PROJECT
The Critical Path Method (CPM) is an algorithm for scheduling a set of project activities. It is an important tool for effective project management. ConceptDraw PROJECT implements this method to provide the user with a wide set of project management tools.Landscape Architecture with ConceptDraw DIAGRAM
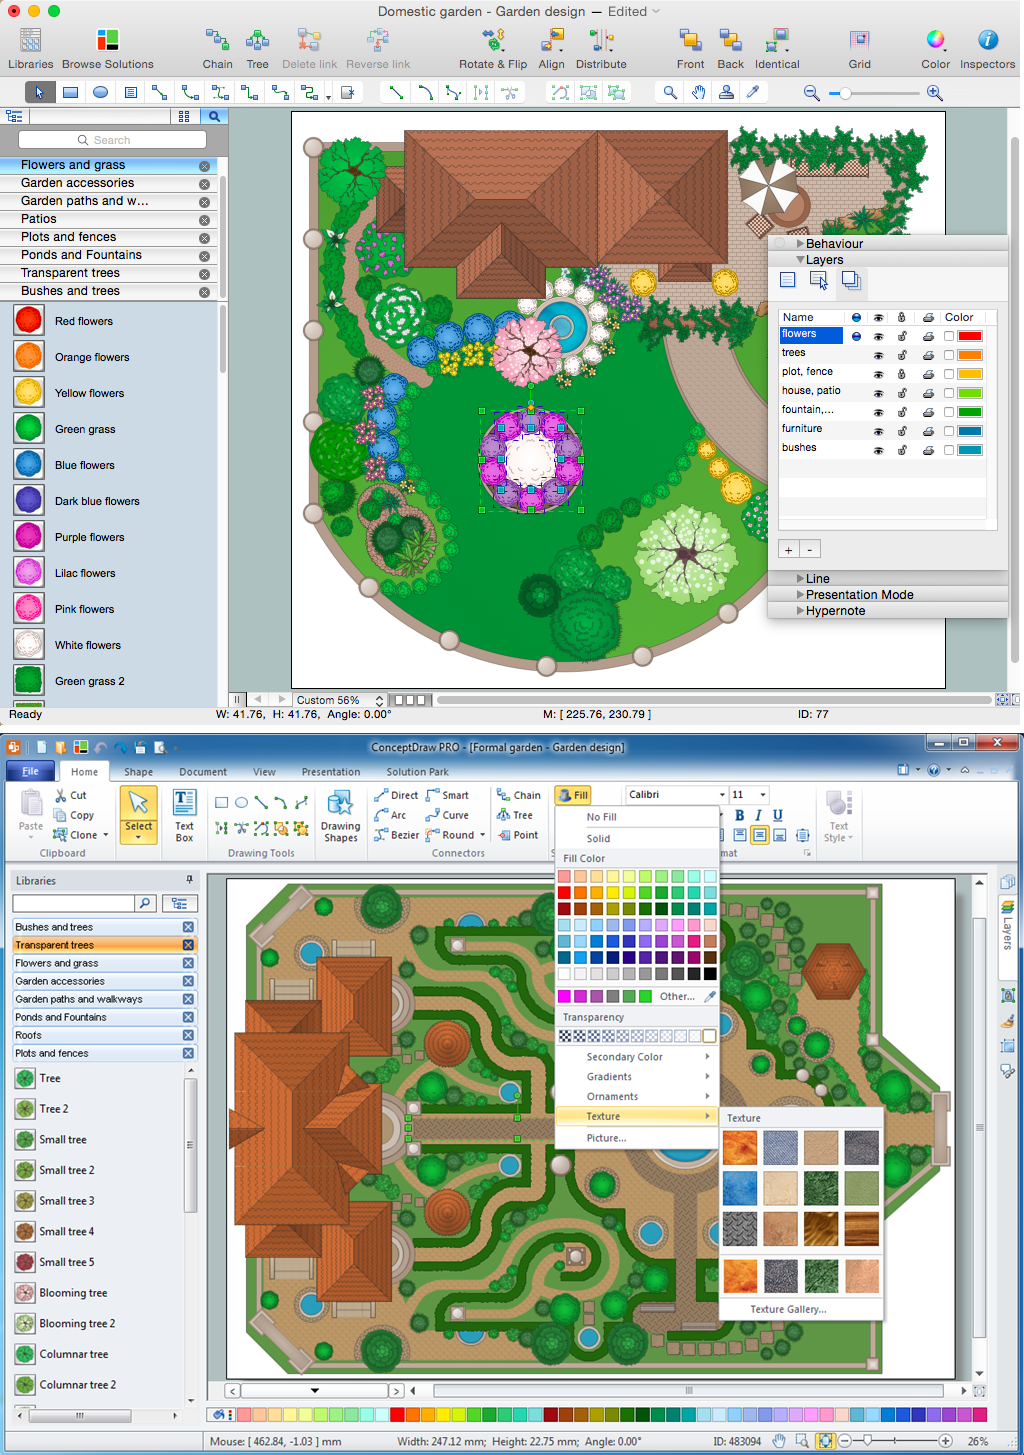
As the landscape created using ConceptDraw is not a static document, it can be used not only in the work of landscape architects and engineers, but also by landscape managers who maintain artificial landscapes such as parks and gardens, or natural landscapes like woodlands or nature reserves.The Landscape and Garden solution contains 14 libraries containing 420 vector graphics shapes, is suitable for any green-fingered gardener wondering how to design a garden.
PERT Chart Software
PERT Chart Software - Activity Network and Project Evaluation and Review Technique, or PERT, charts are a way of documenting and analyzing the tasks in a project.ConceptDraw DIAGRAM is a powerful diagramming and vector drawing software for designing professional looking PERT Charts quick and easy.
How to Discover Critical Path on a Gantt Chart
ConceptDraw PROJECT is the Gantt chart software that implements critical path method to provide the user with a wide set of project management tools.Program Evaluation and Review Technique (PERT) with ConceptDraw DIAGRAM
PERT Diagram is a more realistic approach of a project's time estimate analysis. After PERT chart was constructed user can discover the shortest possible duration for entire project timescale. The project timeline is the longest chain that might be taken with connected tasks on the PERT Diagram. Completion of serial tasks need to be accomplished in a presented order. At a project timeline can be independent tasks that not linked with main sequence they are called parallel tasks. PERT diagram is more suitable for Critical Path Analysis than Gantt chart for the reason that it undoubtedly better determine task dependencies. Project managers customarily utilize both methodologies.What is SWOT Analysis?
SWOT analysis (SWOT Matrix) is a structured planning method used to evaluate the Strengths, Weaknesses, Opportunities, and Threats involved in a project or in a business venture.Activity on Node Network Diagramming Tool
Activity on Node Network Diagramming Tool - Activity Network and Project Evaluation and Review Technique, or PERT, charts are a way of documenting and analyzing the tasks in a project.This sample shows the Activity on node network diagramming method. It was created in ConceptDraw DIAGRAM diagramming and vector drawing software using the Seven Management and Planning Tools solution from the Management area of ConceptDraw Solution Park.
Easy Flowchart Program and Standard Flowchart Symbols
Fast visualization of structured data is main capability of the ConceptDraw DIAGRAM. With numerous vector stencils and standard flowchart symbols from object libraries and the RapidDraw technology this program stands as the best professional flowchart software for drawing with type of flowchart symbols. ConceptDraw DIAGRAM also known as best flowchart maker.HelpDesk
How To Show Critical Path in ConceptDraw PROJECT Server
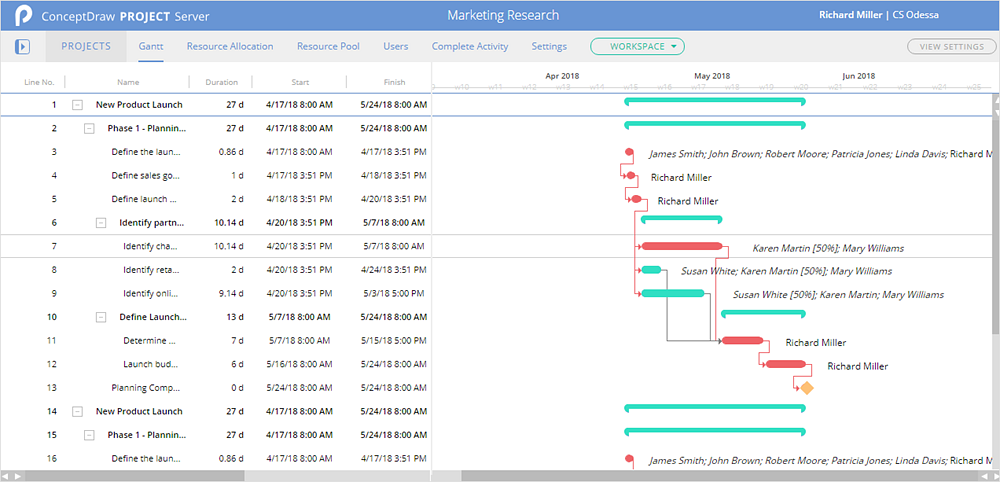
The critical path in project management means the picked tasks that influence the start and finish date of a project. Changing date of these selected tasks leads to change of the finish date for the entire project. ConceptDraw PROJECT Server offers a set of tools to track your project tasks, including the possibility to highlight the critical path. Thus you can view, how much a date shift in one task will influence on your project date.Risk Diagram (Process Decision Program Chart)
Analyze each identified action separately in the tree of all actions and then develop a preventive action in response to potential obstacles or circumstances have been identified as a risk.The PDPC determines the risks when corrective action is not performed correctly. Also, it helps develop descriptions for preventive actions at the level of execution.
Risk Diagram (Process Decision Program Chart)
Analyze each identified action separately in the tree of all actions and then develop a preventive action in response to potential obstacles or circumstances have been identified as a risk.The PDPC determines the risks when corrective action is not performed correctly. Also, it helps develop descriptions for preventive actions at the level of execution.
Gant Chart in Project Management
Gant Chart is a graphical representation of tasks as segments on a time scale. It helps plan and monitor project development or resource allocation. The horizontal axis is a time scale, expressed either in absolute or relative time.
How to Create Presentation of Your Project Gantt Chart
During the planning, discussing and execution of a project you may need to prepare a presentation using project views such as the Gantt Chart, Multiproject Dashboard or Resource Usage View. It’s easy do with ConceptDraw PROJECT!What is Gantt Chart (historical reference)
Historical reference about the Gantt chart.How To create Value Stream Map (VSM)
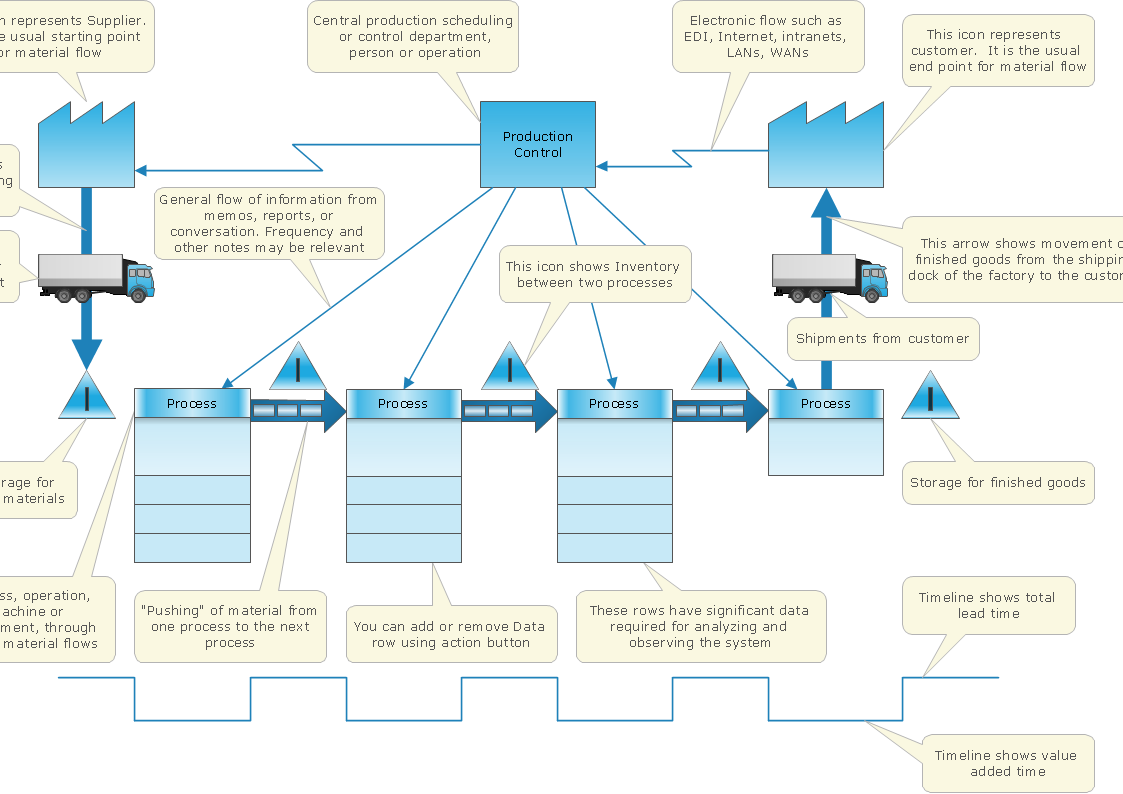
Value Stream Map template helps you to create VSM diagrams using ConceptDraw DIAGRAM software.PROBLEM ANALYSIS. Prioritization Matrix
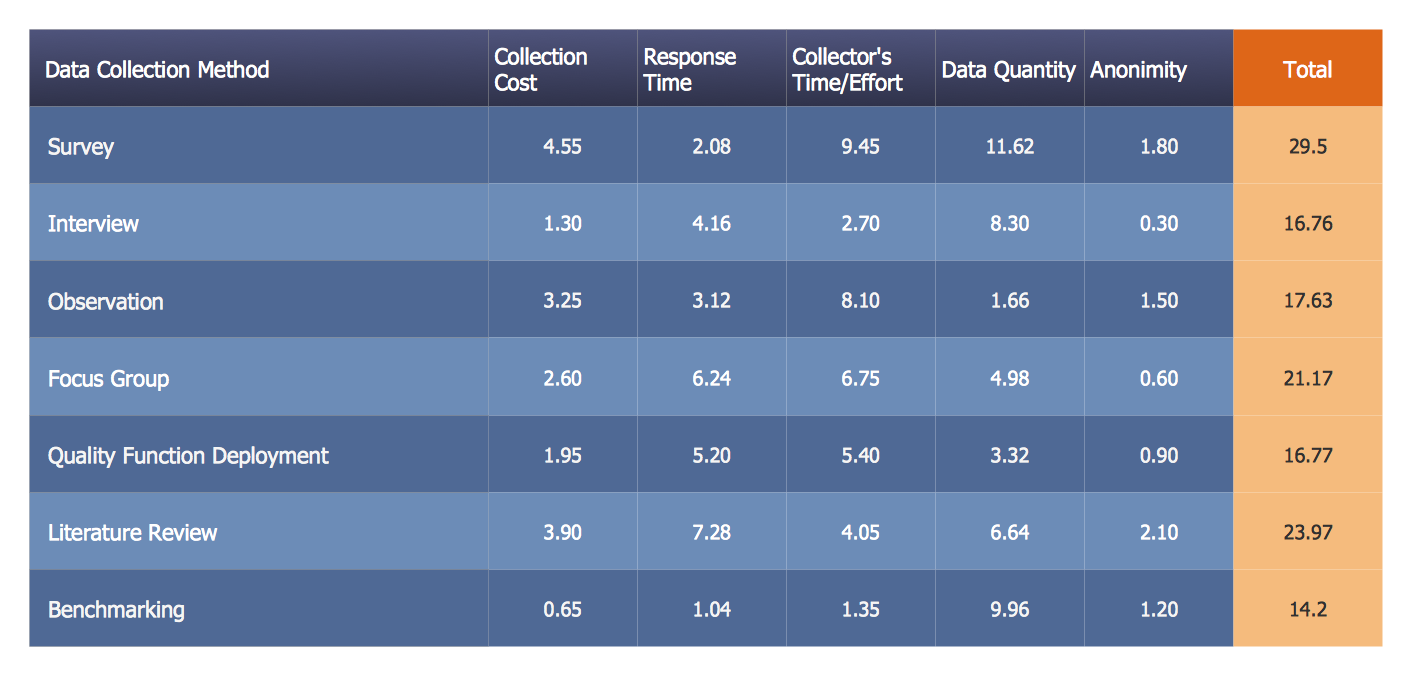
ConceptDraw OFFICE suite is a software for Prioritization Matrix diagram making. This diagram ranks the drivers’ factors to determine priority. It identifies the factors of the first priority for analysis of possible corrective actions. It assesses the weight of each factor for each criterion and specifies it in the Prioritization Matrix. The total sum of weights for a factor’s criteria indicates its priority.
Diagramming Software for Design UML Activity Diagrams
Activity diagram describes the business and operational step-by-step workflows of components in a system. An activity diagram shows the overall flow of control.
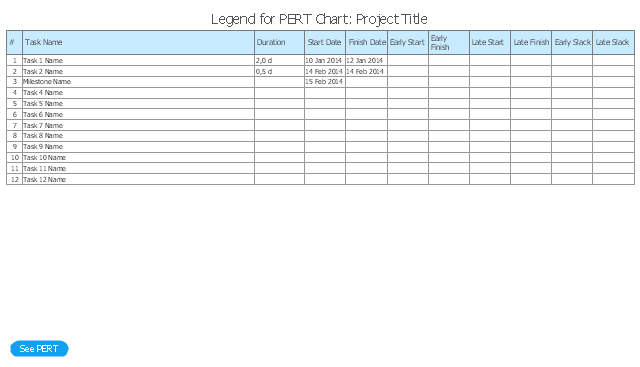
The PERT chart shows the logical connections and consequence of a set of tasks. PERT charts the time period for problem solving and the implementation plan for all activities along the critical path. The PERT chart is also known as a precedence diagram or project network diagram.
"The Program (or Project) Evaluation and Review Technique, commonly abbreviated PERT, is a statistical tool, used in project management, that is designed to analyze and represent the tasks involved in completing a given project. ...
PERT is a method to analyze the involved tasks in completing a given project, especially the time needed to complete each task, and to identify the minimum time needed to complete the total project.
PERT was developed primarily to simplify the planning and scheduling of large and complex projects. ...
A network diagram can be created by hand or by using diagram software. There are two types of network diagrams, activity on arrow (AOA) and activity on node (AON). Activity on node diagrams are generally easier to create and interpret." [Program Evaluation and Review Technique. Wikipedia]
The PERT chart is one of the Seven Management and Planning Tools (7 MP tools, Seven New Quality Tools).
The PERT chart template for the ConceptDraw PRO diagramming and vector drawing software is included in the solution "Seven Management and Planning Tools" from the Management area of ConceptDraw Solution Park.
7 Management & Planning Tools
The "7 Management and Planning Tools" solution implements well-known methodologies for problem analysis and solving. Different products from the ConceptDraw Office suite can be used as a complete solution for any of the methodologies in this solution. ConceptDraw Office provides visual communication during every stage of work.Activity Network (PERT) Chart
Activity Network and Project Evaluation and Review Technique, or PERT, charts are a way of documenting and analyzing the tasks in a project.This diagram is constructed as part of the process in creating a schedule of corrective actions. The Activity Network Chart (PERT) shows the logical connections and consequence of tasks to be performed. It displays the time period for problem solving and the implementation of all activities through the critical path.
- Critical Path Method Software Download
- Critical Path Method in ConceptDraw PROJECT | How to Discover ...
- ConceptDraw PROJECT Project Management Software Tool | Free ...
- Gant Chart in Project Management | ConceptDraw PROJECT ...
- How to Use Critical Path Analysis for Scheduling Complex Projects ...
- Critical Path Method in ConceptDraw PROJECT | Customer ...
- Critical Path Symbols
- Critical Path Method in ConceptDraw PROJECT | Seven ...
- What Is The Difference Between Gantt Chart And Critical Path Method
- How to Discover Critical Path on a Gantt Chart | Critical Path Method ...
- How to Use Critical Path Analysis for Scheduling Complex Projects ...
- How to Discover Critical Path on a Gantt Chart | Critical Path Method ...
- How to Discover Critical Path on a Gantt Chart | Gantt chart ...
- Workflow Of Restaurant Software Project
- How to Use Critical Path Analysis for Scheduling Complex Projects ...
- How to Discover Critical Path on a Gantt Chart | How to Use Critical ...
- Good Flow Chart app for Mac | Gant Chart in Project Management ...
- How to Use Critical Path Analysis for Scheduling Complex Projects ...
- Critical Path Method in ConceptDraw PROJECT | How To create ...
- How to Discover Critical Path on a Gantt Chart | Critical Path Method ...
- ERD | Entity Relationship Diagrams, ERD Software for Mac and Win
- Flowchart | Basic Flowchart Symbols and Meaning
- Flowchart | Flowchart Design - Symbols, Shapes, Stencils and Icons
- Flowchart | Flow Chart Symbols
- Electrical | Electrical Drawing - Wiring and Circuits Schematics
- Flowchart | Common Flowchart Symbols
- Flowchart | Common Flowchart Symbols

