Process Flowchart


Basic Flowchart Symbols and Meaning


Types of Flowcharts


Types of Flowchart - Overview

HelpDesk
How to Create a Business Process Workflow Diagram Using ConceptDraw PRO

 macOS User Interface
macOS User Interface solution extends the ConceptDraw PRO functionality with powerful GUI software graphic design features and tools. It provides an extensive range of multifarious macOS Sierra user interface design examples, samples and templates, and wide variety of libraries, containing a lot of pre-designed vector objects of Mac Apps icons, buttons, dialogs, menu bars, indicators, pointers, controls, toolbars, menus, and other elements for fast and simple designing high standard user interfaces of any complexity for new macOS Sierra.
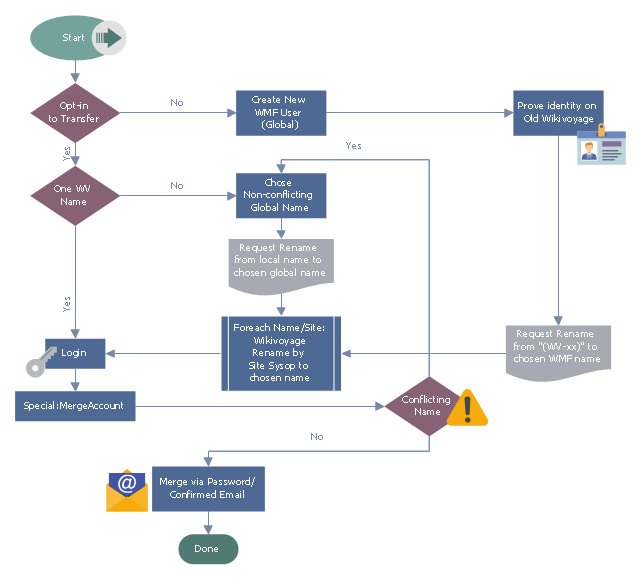
This flowchart example was designed on the base of the Wikimedia Commons file: Wikivoyage Global ID Workflow.svg.
"Workflow for getting a global username for Wikivoyage users migrating to WMF." [commons.wikimedia.org/ wiki/ File:Wikivoyage_ Global_ ID_ Workflow.svg]
This file is licensed under the Creative Commons Attribution-Share Alike 3.0 Unported license. [creativecommons.org/ licenses/ by-sa/ 3.0/ deed.en]
"Your global account (also called unified login or SUL/ single user login) is your single username reserved across all Wikimedia projects (except some special wikis). This gives you a consistent identity throughout Wikimedia, enables features like global user pages, reduces vectors for impersonation, and lets you visit many projects without manually logging in on each wiki." [meta.wikimedia.org/ wiki/ Help:Unified_ login]
The flowchart example "Wikivoyage Global ID Workflow" was created using ConceptDraw PRO software extended with the Business Process Workflow Diagrams solution from the Business Processes area of ConceptDraw Solution Park.
Business process flowchart
Network Security Tips

 Social Media Response
This solution extends ConceptDraw DIAGRAM and ConceptDraw MINDMAP with the ability to draw interactive flow charts with action mind map templates, to help create an effective response to applicable social media mentions.
Symboles Organigramme

Voir aussi d'autres symboles organigramme: Symboles ordinogramme standard, symboles du flux de travail, Vérification Les symboles du schéma fonctionnel, sOrganigramme comptables des symboles, Organigramme de vente des symboles, Symboles pour organigramme des RH, Carte des symboles de processus, Diagramme de processus opérationnels, Symboles utilisés dans le schéma IDEF0.
Business Process Workflow Diagram

The workflows on the Business Process Workflow Diagram are represented using the set of common symbols which let easy illustrate business processes and process flows, depict the start, all major steps and end of the process, what data are used by the process, how the data flow through the business areas within scope of our project, how the tasks are executed and by who, and how workers interact with each other.

Entity Relationship Diagram Examples

ConceptDraw gives the ability to describe a database using the Entity-Relationship model. Entity-Relationship Diagram solution includes icons advocated by Chen's and Crow’s Foot notation that can be used when describing a database.

- Creating Email Id Flowchart
- What Is The Algorithm Of Creating An Email Account And It Flow Chart
- How To Create A Email Id With The Help Of Flowchart
- Ow To Create A Email Id With The Help Of Flow Chart
- Flow Chart For Email Serves
- How To Create Email Id And Its Flow Chat
- What Are The Flow Chart Of Creating E Mail
- How To Create A Email Id With The Help Of Flowchart File
- Process Flowchart | PM Planning | Visio Exchange | Send Email Dfd
- How to Send an Outlook Email From a Mind Map | Software for ...
- Create E Mail Id Flow Chart
- Email Flowchart Symbol
- Data Flow Diagrams | Process Flowchart | Accounting Information ...
- Flow Chart Of How To Make A Email Id
- What Is Dfd Of Email
- Statechart Diagram For Creation Of Email Id
- Flow Chart Of E Mail
- How To Create An Email Account Steps In Flow Chart
- Draw Architecture Of Email System
- Cross Functional Flowchart Symbols For Email
- ERD | Entity Relationship Diagrams, ERD Software for Mac and Win
- Flowchart | Basic Flowchart Symbols and Meaning
- Flowchart | Flowchart Design - Symbols, Shapes, Stencils and Icons
- Flowchart | Flow Chart Symbols
- Electrical | Electrical Drawing - Wiring and Circuits Schematics
- Flowchart | Common Flowchart Symbols
- Flowchart | Common Flowchart Symbols