HelpDesk
How to Create an Enterprise Architecture Diagram

 Enterprise Architecture Diagrams
Enterprise Architecture Diagrams solution extends ConceptDraw DIAGRAM software with templates, samples and library of vector stencils for drawing the diagrams of enterprise architecture models.
 AWS Architecture Diagrams
AWS Architecture Diagrams with powerful drawing tools and numerous predesigned Amazon icons and AWS simple icons is the best for creation the AWS Architecture Diagrams, describing the use of Amazon Web Services or Amazon Cloud Services, their application for development and implementation the systems running on the AWS infrastructure. The multifarious samples give you the good understanding of AWS platform, its structure, services, resources and features, wide opportunities, advantages and benefits from their use; solution’s templates are essential and helpful when designing, description and implementing the AWS infrastructure-based systems. Use them in technical documentation, advertising and marketing materials, in specifications, presentation slides, whitepapers, datasheets, posters, etc.
 Business Process Diagrams
Business Process Diagrams solution extends the ConceptDraw DIAGRAM BPM software with RapidDraw interface, templates, samples and numerous libraries based on the BPMN 1.2 and BPMN 2.0 standards, which give you the possibility to visualize equally easy simple and complex processes, to design business models, to quickly develop and document in details any business processes on the stages of project’s planning and implementation.
Information Architecture
 Cisco Network Diagrams
Cisco Network Diagrams solution extends ConceptDraw DIAGRAM with the best characteristics of network diagramming software. Included samples, templates and libraries of built-in standardized vector Cisco network icons and Cisco symbols of computers, network devices, network appliances and other Cisco network equipment will help network engineers, network designers, network and system administrators, as well as other IT professionals and corporate IT departments to diagram efficiently the network infrastructure, to visualize computer networks topologies, to design Cisco computer networks, and to create professional-looking Cisco Computer network diagrams, Cisco network designs and schematics, Network maps, and Network topology diagrams in minutes.
 IDEF Business Process Diagrams
Use the IDEF Business Process Diagrams solution to create effective database designs and object-oriented designs, following the integration definition methodology.
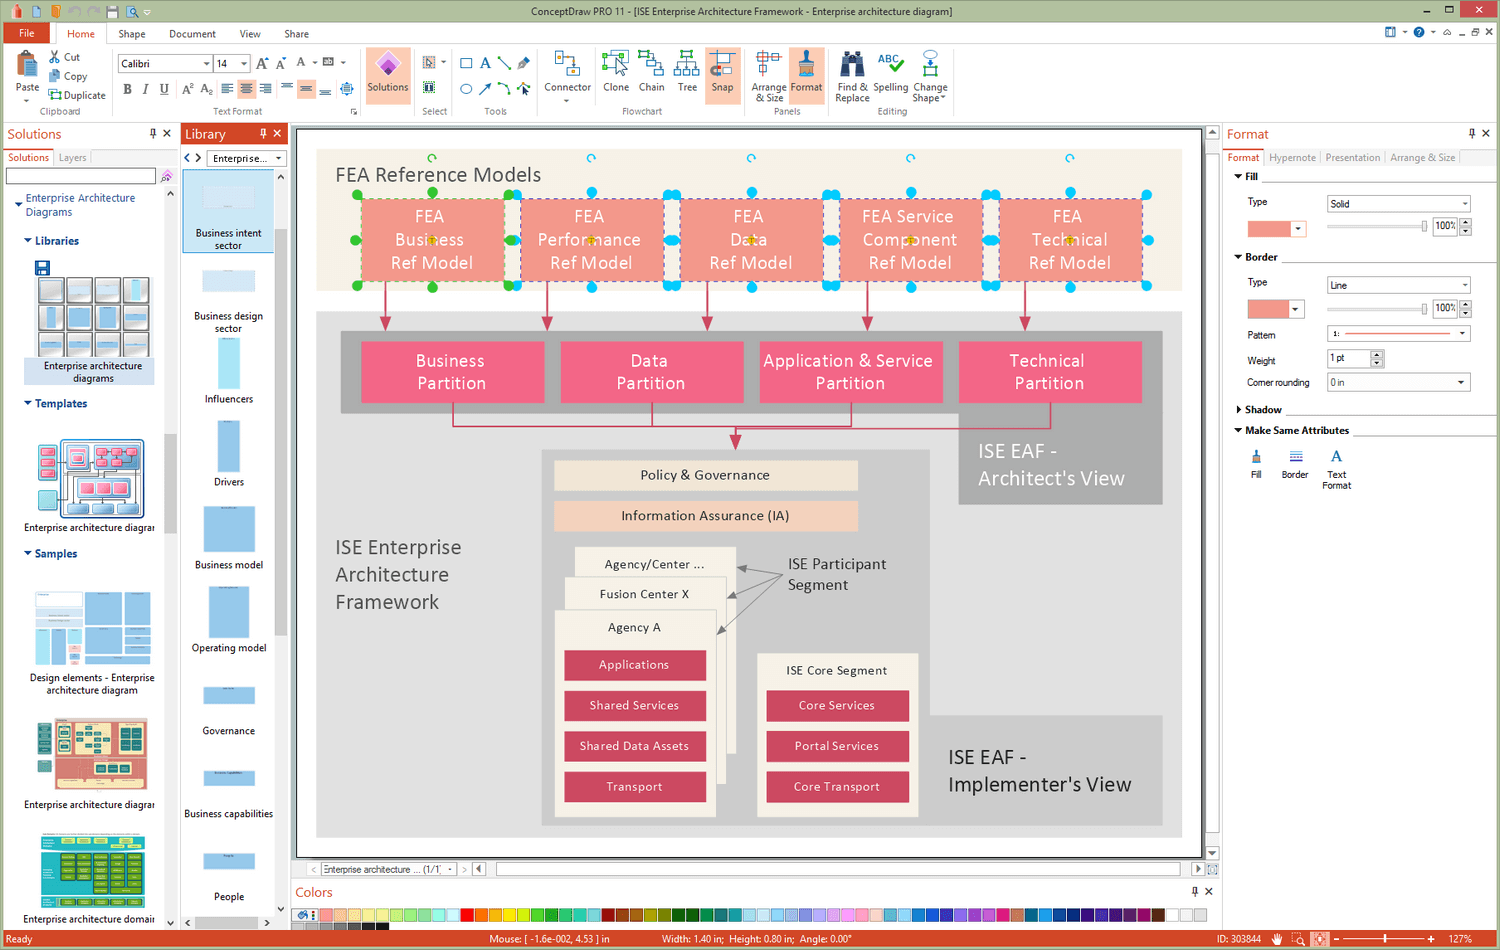
This enterprise architecture diagram example was drawn on the base of the figure illustrating the webpage "ISE Enterprise Architecture Framework 2007" from the Semantic Community website. "The ISE Enterprise Architecture Framework.
As Figure ... depicts, the Federal Enterprise Architecture (FEA) Reference Models (RMs) provide the basis for the ISE EAF. All elements of the ISE EAF are mapped back to elements of the FEA RMs with the FEA management processes applied by the OMB leveraged in support of implementing the ISE. The four ISE EAF partitions are mapped to the five FEA RMs to enable tracking the development of the ISE EAF across agencies using standardized OMB policies and processes that structure EA development and budgeting processes. The ISE EAF also provides an overarching mapping of the ISE into not only Federal civil systems, but also national security systems. ...
Two primary views are used to describe the ISE EAF: 1) the Architect’s View and 2) the Implementer’s View. While the term “view” is typically used to refer to different aspects of an architecture, the OMB suggested the term “partition” rather than the more common terms “architecture” or “view” to differentiate the ISE approach as a framework from the approach typically used in departmental and agency EAs. The Architect’s View comprises four partitions:
1) Business,
2) Data,
3) Application and Service, and
4) Technical.
The Architect’s View is used to provide structural alignment of the ISE architectural components into the FEA structure to ensure strategies, business processes, investments, data, systems, and technologies within the ISE are integrated and compatible with those across the Federal government."
[semanticommunity.info/ Information_ Sharing_ Environment/ ISE_ Enterprise_ Architecture_ Framework_ 2007#Figure_ ES-2._ The_ ISE_ Enterprise_ Architecture_ Framework_ Is_ Defined_ by_ Two_ Views_ and_ Four_ Partitions]
The diagram example "The ISE Enterprise Architecture Framework" was created using the ConceptDraw PRO diagramming and vector drawing software extended with the Enterprise Architecture Diagrams solution from the Management area of ConceptDraw Solution Park.
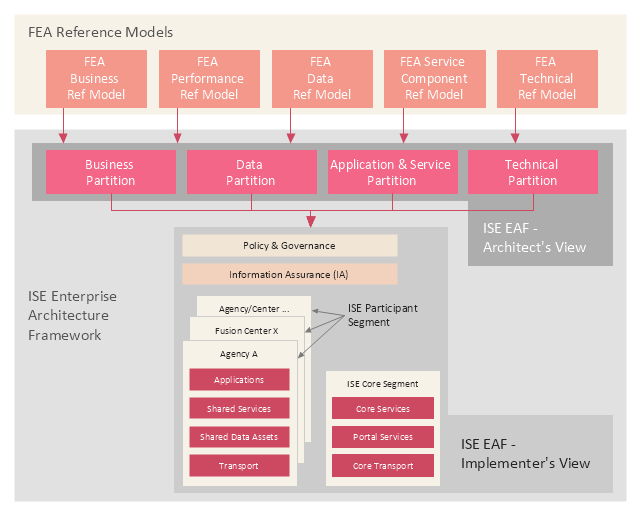
Enterprise architecture diagram
 Fishbone Diagrams
The Fishbone Diagrams solution extends ConceptDraw DIAGRAM software with the ability to easily draw the Fishbone Diagrams (Ishikawa Diagrams) to clearly see the cause and effect analysis and also problem solving. The vector graphic diagrams produced using this solution can be used in whitepapers, presentations, datasheets, posters, and published technical material.
 Stakeholder Onion Diagrams
The Stakeholder Onion Diagram is often used as a way to view the relationships of stakeholders to a project goal. A basic Onion Diagram contains a rich information. It shows significance of stakeholders that will have has influence to the success achieve
- Enterprise Architecture Diagrams | How to Create an Enterprise ...
- Core Diagram Enterprise Architecture
- AWS Architecture Diagrams | Business Process Diagrams | Cisco ...
- Enterprise Architecture Diagrams | Business Architecture | NIH IT ...
- AWS Architecture Diagrams | Computer Network Architecture ...
- Enterprise Architecture Diagrams | Information Technology ...
- Design elements - Building core | Enterprise Architecture Diagrams ...
- ATM UML Diagrams | AWS Architecture Diagrams | Bank System ...
- Enterprise Data Architecture Diagram
- How to Create an Enterprise Architecture Diagram in ConceptDraw ...
- ERD | Entity Relationship Diagrams, ERD Software for Mac and Win
- Flowchart | Basic Flowchart Symbols and Meaning
- Flowchart | Flowchart Design - Symbols, Shapes, Stencils and Icons
- Flowchart | Flow Chart Symbols
- Electrical | Electrical Drawing - Wiring and Circuits Schematics
- Flowchart | Common Flowchart Symbols
- Flowchart | Common Flowchart Symbols