Business process Flow Chart — Event-Driven Process chain (EPC) diagrams
 diagrams *")
Functional Flow Block Diagram

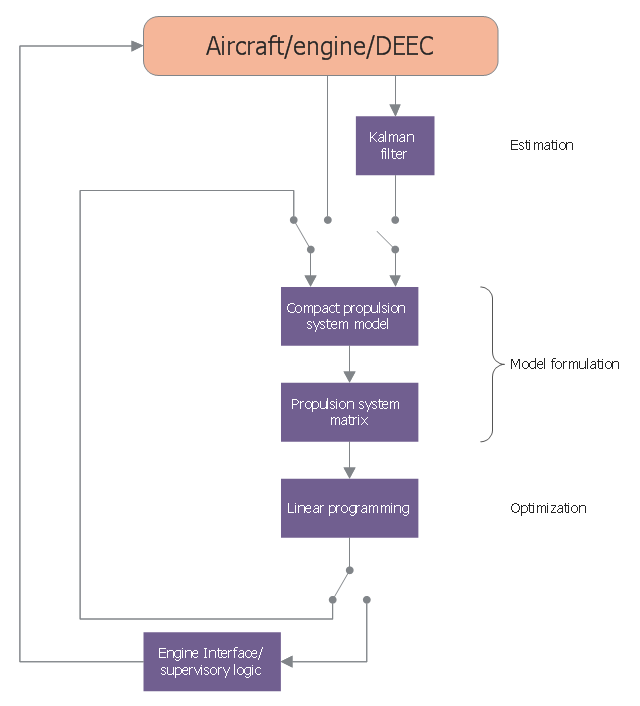
This CFD sample was designed on the base of Wikimedia Commons file: Performance seeking control flow diagram.jpg.
[commons.wikimedia.org/ wiki/ File:Performance_ seeking_ control_ flow_ diagram.jpg]
Source of this CFD is Subsonic Flight Test Evaluationof a Performance Seeking ControlAlgorithm on an F-15 Airplane NASA Technical Memorandum 4400. [nasa.gov/ centers/ dryden/ pdf/ 88262main_ H-1808.pdf]
The CFD example "Control flow diagram - Performance Seeking" was designed using ConceptDraw PRO software extended with Сlassic Business Process Modeling solution from Business Processes area of ConceptDraw Solution Park.
Business process modeling diagram
Used Solutions
 Classic Business Process Modeling
The ConceptDraw DIAGRAM software enhanced with Classic Business Process Modeling solution is a powerful flowchart maker and professional business process modeling software with extensive choice of drawing tools, libraries with wide variety of ready-to-use vector objects that are more than sufficient for modeling the business processes and for instant creation variety of diagram types: Control Flow Diagram, Swimlane Diagram, Business Process Modeling Diagram, Functional Flow Block Diagram, Data Flow Diagram. It is ideal for business analysts, developers, as well as for managers and regular users. The samples included to Classic Business Process Modeling solution allow to uncover the solution’s power and to answer qualitatively on how to create a flowchart or to model the business processes with help of diagrams and schemes.
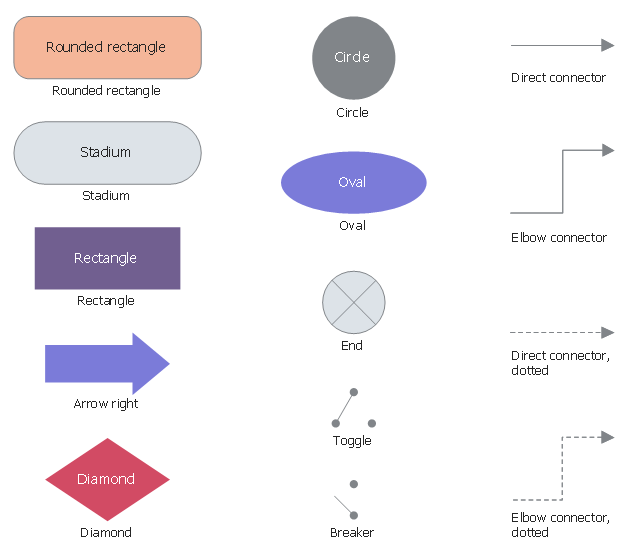
The vector stencils library "Control flow diagram" contains 14 CFD notation symbols.
Use it to draw your control flow diagrams with ConceptDraw PRO software.
The CFD symbols example "Design elements - Control flow diagram" is included in Сlassic Business Process Modeling solution from Business Processes area of ConceptDraw Solution Park.
Use it to draw your control flow diagrams with ConceptDraw PRO software.
The CFD symbols example "Design elements - Control flow diagram" is included in Сlassic Business Process Modeling solution from Business Processes area of ConceptDraw Solution Park.
Vector stencils
Data Flow Diagrams

Interaction Overview Diagram


Seven Basic Tools of Quality - Flow Chart

Software Diagram Examples and Templates

Software Development area of ConceptDraw Solution Park provides 5 solutions:
Data Flow Diagrams, Entity-Relationship Diagram (ERD), Graphic User Interface, IDEFO Diagrams, Rapid UML.
Types of Flowcharts


Diagramming Software for Design UML Interaction Overview Diagrams

Types of Flowcharts
Workflow Diagram Examples

Technical Flow Chart Example

ConceptDraw DIAGRAM enhanced with Flowcharts Solution from the "Diagrams" Area of ConceptDraw Solution is a perfect software for drawing Technical Flow Chart Example illustrating the essence and importance of the technical flow chart use.
Process Flow Diagram

ConceptDraw DIAGRAM diagramming and vector drawing software extended with powerful tools of Flowcharts Solution from the "Diagrams" Area of ConceptDraw Solution Park is effective for drawing: Process Flow Diagram, Flow Process Diagram, Business Process Flow Diagrams.
Process Flow Chart

ConceptDraw DIAGRAM diagramming and vector drawing software extended with Flowcharts Solution from the "Diagrams" Area of ConceptDraw Solution Park is the best way to create Process Flow Chart and other types of flowcharts.
Flow chart Example. Warehouse Flowchart

Standard warehousing process flow diagram and standard workflow diagram used for process identification for further evaluating effectiveness and profitability of overall business process. Use the ConceptDraw DIAGRAM diagramming and vector drawing software extended with the Flowcharts solution from the Diagrams area of ConceptDraw Solution Park to design your own workflow diagrams, process flow diagram and flow charts. Need to use Process Flow Diagram for designing Warehouse packages flow.

Definition TQM Diagram

Data Flow Diagrams

 Event-driven Process Chain Diagrams
Event-Driven Process Chain Diagrams solution extends ConceptDraw DIAGRAM functionality with event driven process chain templates, samples of EPC engineering and modeling the business processes, and a vector shape library for drawing the EPC diagrams and EPC flowcharts of any complexity. It is one of EPC IT solutions that assist the marketing experts, business specialists, engineers, educators and researchers in resources planning and improving the business processes using the EPC flowchart or EPC diagram. Use the EPC solutions tools to construct the chain of events and functions, to illustrate the structure of a business process control flow, to describe people and tasks for execution the business processes, to identify the inefficient businesses processes and measures required to make them efficient.
- Control flow diagram
- Control Flow Diagram Banking System
- Stock Control Process Flow Chart
- Process Flowchart | TQM Diagram Example | Definition TQM ...
- Creating Control Flow Modelling In Software Engineering
- TQM Diagram Example | Process Flowchart | Quality Control Chart ...
- Control Flow Diagram For Event Management
- Design elements - Control flow diagram | Business process Flow ...
- Data Flow Diagram Example | Technical Flow Chart | Data Flow ...
- Control Flow Diagram Symbols
- Production Planning And Control Process Flow Chart
- Control Flow Diagram For Online Shopping
- Process Flowchart | TQM Software — Build Professional TQM ...
- Control Flow
- Production Planning Process Flow Diagram
- Production Planning And Control Flow Chart
- UML Diagram | Process Flowchart | UML Activity Diagram | Control ...
- Control Flow Diagram Of Hospital Management System Wikipedia
- How to Simplify Flow Charting — Cross-functional Flowchart | In ...
- ATM UML Diagrams | Control Flow Graph For Atm Withdrawal System
- ERD | Entity Relationship Diagrams, ERD Software for Mac and Win
- Flowchart | Basic Flowchart Symbols and Meaning
- Flowchart | Flowchart Design - Symbols, Shapes, Stencils and Icons
- Flowchart | Flow Chart Symbols
- Electrical | Electrical Drawing - Wiring and Circuits Schematics
- Flowchart | Common Flowchart Symbols
- Flowchart | Common Flowchart Symbols