"A registered user is one who uses a program or a website and provides his/ her credentials, effectively proving his/ her identity. ...
Generally speaking, any person can become a registered user by providing some credentials, usually in the form of a username (or email) and password. After that, one can access information and privileges unavailable to non-registered users, usually referred to simply as guests. The action of providing the proper credentials for a website is called logging in, or signing in." [Registered user. Wikipedia]
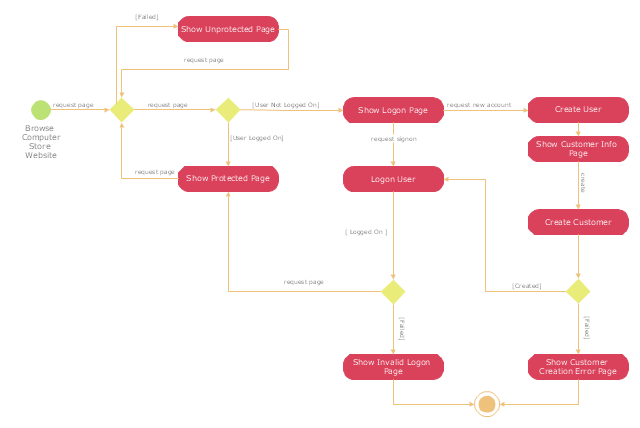
The UML activity diagram example "User registration" was created using the ConceptDraw PRO diagramming and vector drawing software extended with the Rapid UML solution from the Software Development area of ConceptDraw Solution Park.
Generally speaking, any person can become a registered user by providing some credentials, usually in the form of a username (or email) and password. After that, one can access information and privileges unavailable to non-registered users, usually referred to simply as guests. The action of providing the proper credentials for a website is called logging in, or signing in." [Registered user. Wikipedia]
The UML activity diagram example "User registration" was created using the ConceptDraw PRO diagramming and vector drawing software extended with the Rapid UML solution from the Software Development area of ConceptDraw Solution Park.
UML activity diagram
 Event-driven Process Chain Diagrams
Event-driven Process Chain (EPC) Diagram is a type of flowchart widely used for modeling in business engineering and reengineering, business process improvement, and analysis. EPC method was developed within the Architecture of Integrated Information Systems (ARIS) framework.
 Total Quality Management TQM Diagrams
Total Quality Management Diagrams solution extends ConceptDraw PRO software with samples, templates and vector stencils library for drawing the TQM flowcharts.
 Fishbone Diagram
Fishbone Diagrams solution extends ConceptDraw PRO software with templates, samples and library of vector stencils for drawing the Ishikawa diagrams for cause and effect analysis.
 Network Layout Floor Plans
Network Layout Floor Plans solution extends ConceptDraw PRO software functionality with powerful tools for quick and efficient documentation the network equipment and displaying its location on the professionally designed Network Layout Floor Plans. Never before creation of Network Layout Floor Plans, Network Communication Plans, Network Topologies Plans and Network Topology Maps was not so easy, convenient and fast as with predesigned templates, samples, examples and comprehensive set of vector design elements included to the Network Layout Floor Plans solution. All listed types of plans will be a good support for the future correct cabling and installation of network equipment.
 Accounting Flowcharts
Accounting Flowcharts solution extends ConceptDraw PRO software with templates, samples and library of vector stencils for drawing the accounting flow charts.
 Flowcharts
The Flowcharts Solution for ConceptDraw PRO v10 is a comprehensive set of examples and samples in several different color themes for professionals that need to graphically represent a process. Solution value is added by basic flow chart template and shapes' library of Flowchart notation. ConceptDraw PRO flow chart creator lets one depict a processes of any complexity and length, as well design of the flowchart either vertically or horizontally.
 Cross-Functional Flowcharts
Cross-functional flowcharts are powerful and useful tool for visualizing and analyzing complex business processes which requires involvement of multiple people, teams or even departments. They let clearly represent a sequence of the process steps, the order of operations, relationships between processes and responsible functional units (such as departments or positions).
- UML activity diagram - User registration | ATM UML Diagrams ...
- Contoh Use Case Diagram Facebook
- UML Use Case Diagram Example Registration System | UML activity ...
- Cross-Functional Flowchart (Swim Lanes) | Swim Lane Flowchart ...
- Flowchart | Business process Flow Chart - Event-Driven Process ...
- UML activity diagram - Cash withdrawal from ATM | UML Activity ...
- Basic Flowchart Symbols and Meaning | Processing Flow Chart ...
- Sales Process Flow Chart
- Data Flow Diagram For Email System
- Flowchart | Business process Flow Chart - Event-Driven Process ...
- UML Component Diagram Example - Online Shopping | UML ...
- UML Class Diagram Example - Social Networking Site | UML Use ...
- UML sequence diagram - Help desk | UML Class Diagram ...
- 4 Level pyramid model diagram - Information systems types ...
- UML Activity Diagram | UML Sequence Diagram | Types of ...
- Contoh Flowchart | Technical Flow Chart | Types of Flowcharts ...
- Login and registration processing - EPC diagram | Flowchart ...
- Final object schematic - IDEF3 diagram | Vector stencils library ...
- Flow Chart How To Log In A Website
- UML use case diagram - Banking system
- ERD | Entity Relationship Diagrams, ERD Software for Mac and Win
- Flowchart | Basic Flowchart Symbols and Meaning
- Flowchart | Flowchart Design - Symbols, Shapes, Stencils and Icons
- Flowchart | Flow Chart Symbols
- Electrical | Electrical Drawing - Wiring and Circuits Schematics
- Flowchart | Common Flowchart Symbols
- Flowchart | Common Flowchart Symbols