Data Flow Diagram
Data flow diagram (DFD) is the part of the SSADM method (Structured Systems Analysis and Design Methodology), intended for analysis and information systems projection. Data flow diagrams are intended for graphical representation of data flows in the information system and for analysis of data processing during the structural projection. Data flow diagram often used in connection with human process and can be displayed as workflow diagram. The critical Process Flow Diagram is another flowchart technique for designing data flow in connection with organizational processes. The critical Process flow diagram may use different range of symbols than a classic workflow diagram.Process Flowchart
ConceptDraw is Professional business process mapping software for making process flow diagram, workflow diagram, general flowcharts and technical illustrations for business documents. It is includes rich examples, templates, process flowchart symbols. ConceptDraw flowchart maker allows you to easier create a process flowchart. Use a variety of drawing tools, smart connectors, flowchart symbols and shape libraries to create flowcharts of complex processes, process flow diagrams, procedures and information exchange.
 Data Flow Diagrams (DFD)
Data Flow Diagrams solution extends ConceptDraw PRO software with templates, samples and libraries of vector stencils for drawing the data flow diagrams (DFD).
 IDEF0 Diagrams
IDEF0 Diagrams visualize system models using the Integration Definition for Function Modeling (IDEF) methodology. Use them for analysis, development and integration of information and software systems, and business process modelling.
HelpDesk
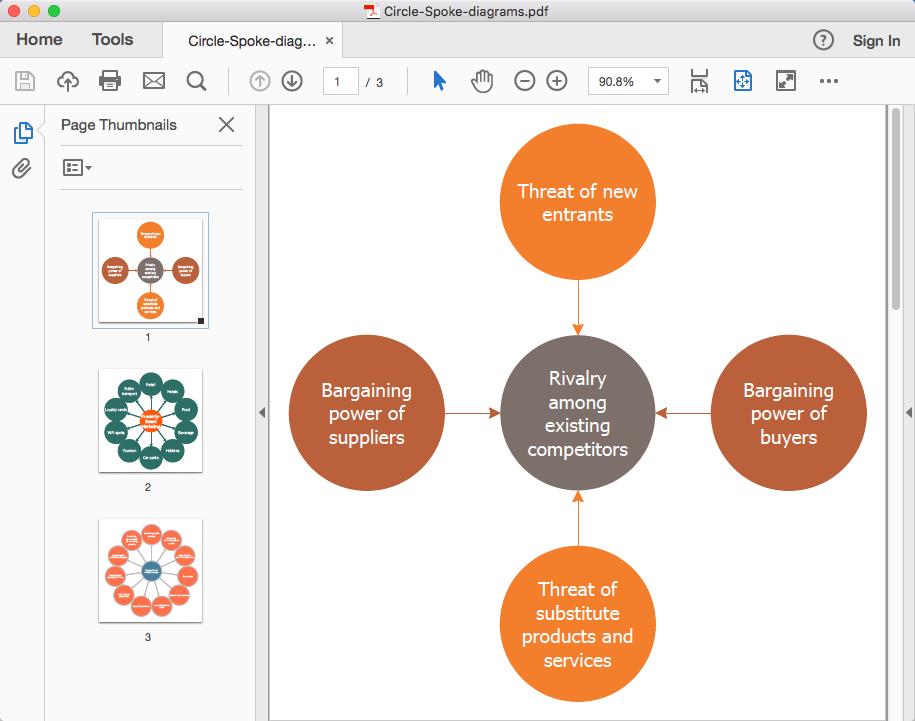
How To Convert a Circle-Spoke Diagram to Adobe PDF
ConceptDraw PRO allows you to easy share your marketing documentation between different computers with different operating systems and applications using it's export capabilities. You can get your marketing diagrams in pdf format and avoid any problems while communicating them.HelpDesk
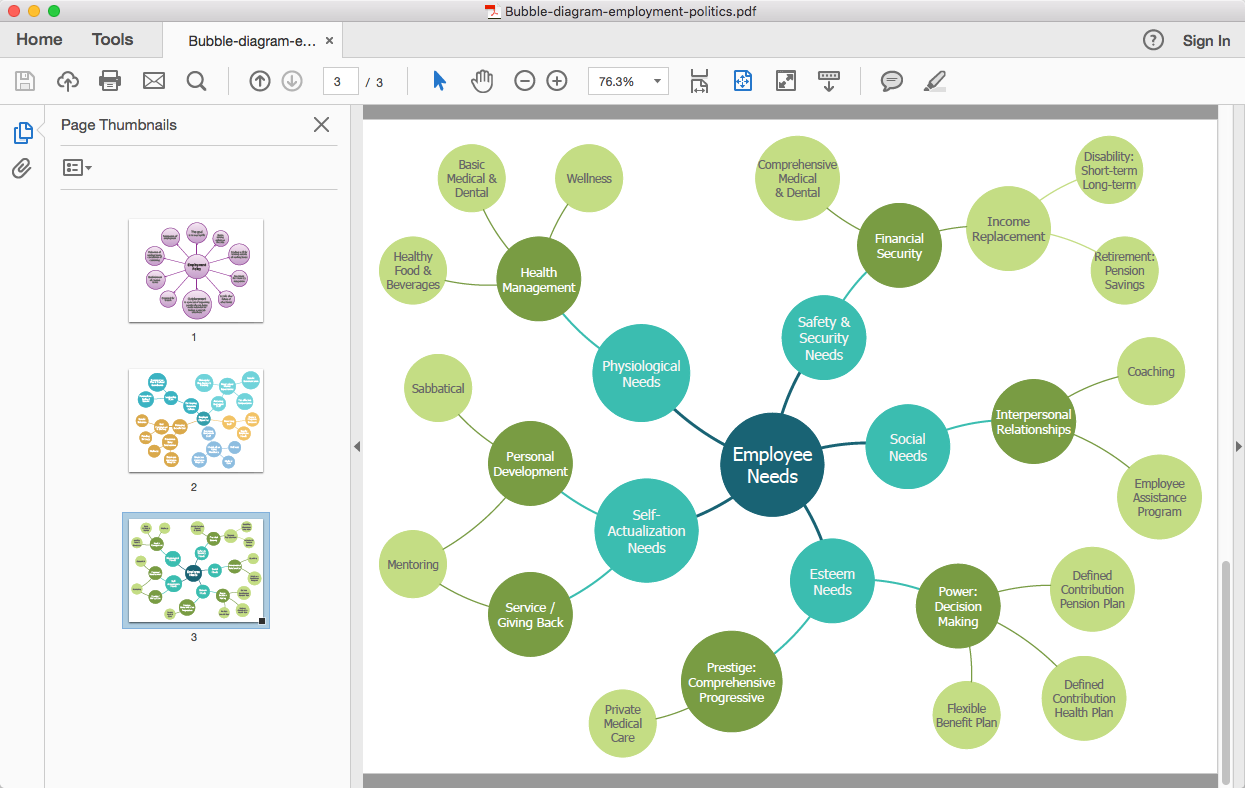
How To Convert a Bubble Diagram to Adobe PDF
ConceptDraw PRO allows you to easy share your business documentation between different computers with different operating systems and applications using it's export capabilities. You can get your bubble diagrams in pdf format and freely communicate them with others.HelpDesk
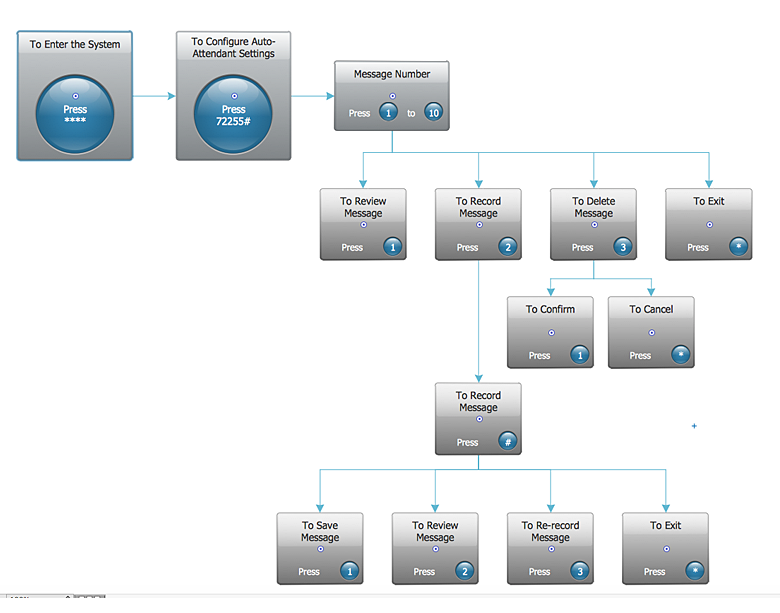
How to Create an Interactive Voice Response (IVR) Diagram in ConceptDraw PRO
Interactive Voice Response (IVR) System is a telecommunication technology that enables a computer to automatically process voice and touch phone signals. IVR systems allows users to interact through a computer with various service systems, available by telephone. The objective of IVR system is to reduce customer service costs by delivering self service to customers and guiding them to the information that they look for. Interactive Voice Response (IVR) Diagram is used to create and conduct the Interactive Voice Response systems for call-centers and voice mail services. IVR diagrams intended to visualize the logical and physical structure of Interactive voice response systems. ConceptDraw solution for Interactive Voice Response (IVR) Diagram allows you to create and communicate the Interactive Voice Response diagram of any complexity.HelpDesk
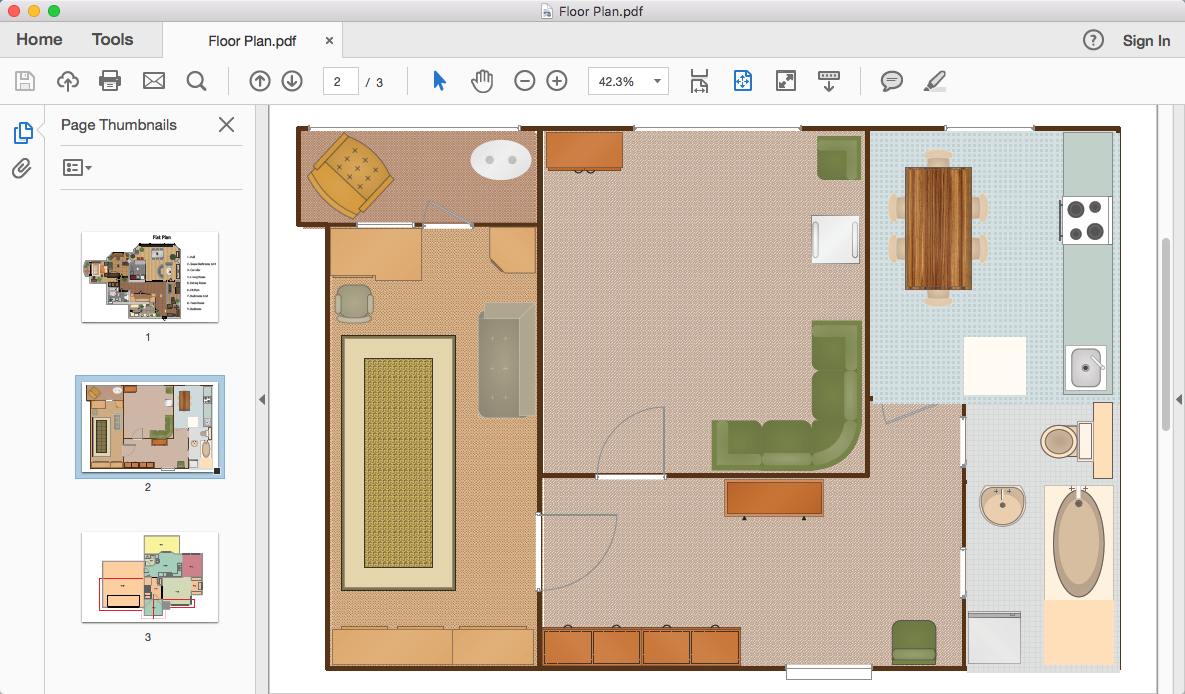
How To Convert a Floor Plan to Adobe PDF
ConceptDraw PRO allows you to easy share your building plans between different computers with different operating systems and applications using it's export capabilities.You can get clear floor plan in pdf format and avoid any problems while communicating it with your Customers and Contractors.HelpDesk
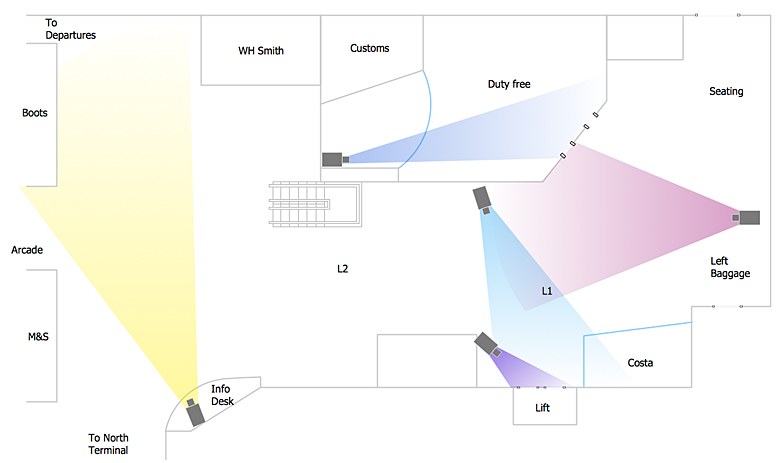
How to Create a CCTV Diagram in ConceptDraw PRO
CCTV (Closed circuit television) diagram is used to depict a system of video monitoring. The CCTV diagram provides video cameras placement strategy.CCTV diagram should include the scheme of strategic placement of video cameras, which capture and transmit videos to either a private network of monitors for real-time viewing, or to a video recorder for later reference. CCTV is commonly used for surveillance and security purposes. Using ConceptDraw PRO with the Security and Access Plans Solution lets you create professional looking video surveillance CCTV system plans, security plans, and access schemes.
HelpDesk
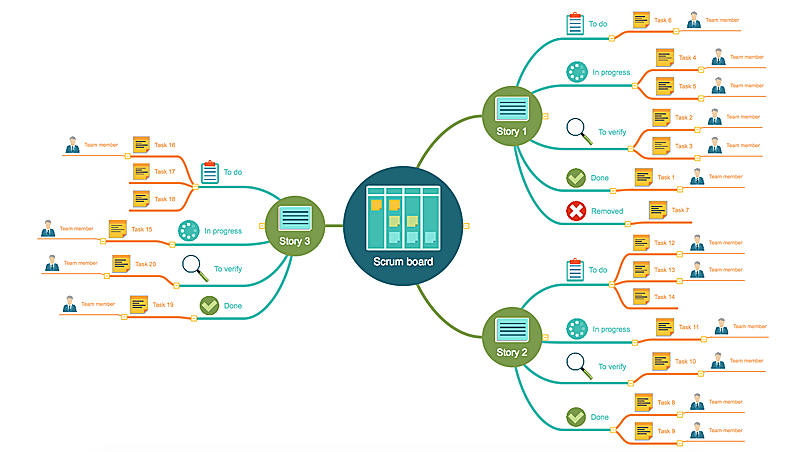
Agile Mind Maps: Exploring the User Wishes
Agile method advocate use cases and user stories, but there are no standard processes or guides available to help gather user requirements. That is why documenting user requirements can be challenging. Without strong communication experience the scrum process can collapse, leading towards unfruitful requirements and imperfect software. This article offers a path to overcome these hurdles through the simplicity and clearness of mind mapping. ConceptDraw Scrum Work flow solution lets explore the user requirements for your Agile development project before they are formalized. You can easily create professional Mind Maps that will effectively collect and structure the information on what a user actually wants, or the User Wish.HelpDesk
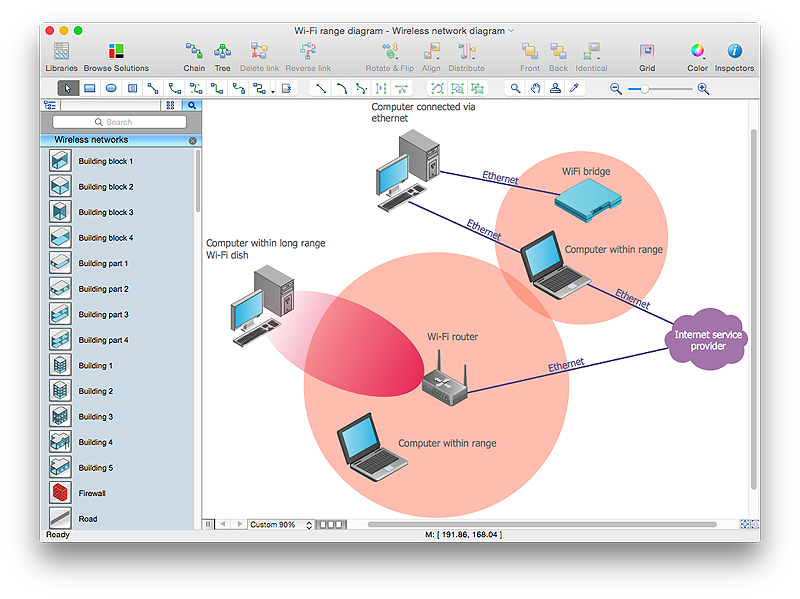
How to Create a Wireless Network Diagram
A wireless network diagram is a specialized type of computer network diagrams. Wireless Network diagrams are used to develop, operate and maintain the WLAN systems. Making a Wireless Network diagram involves many different elements that can be managed using ConceptDraw PRO. With ConceptDraw PRO you can easily create and communicate the Wireless Network diagram of any complexity.HelpDesk
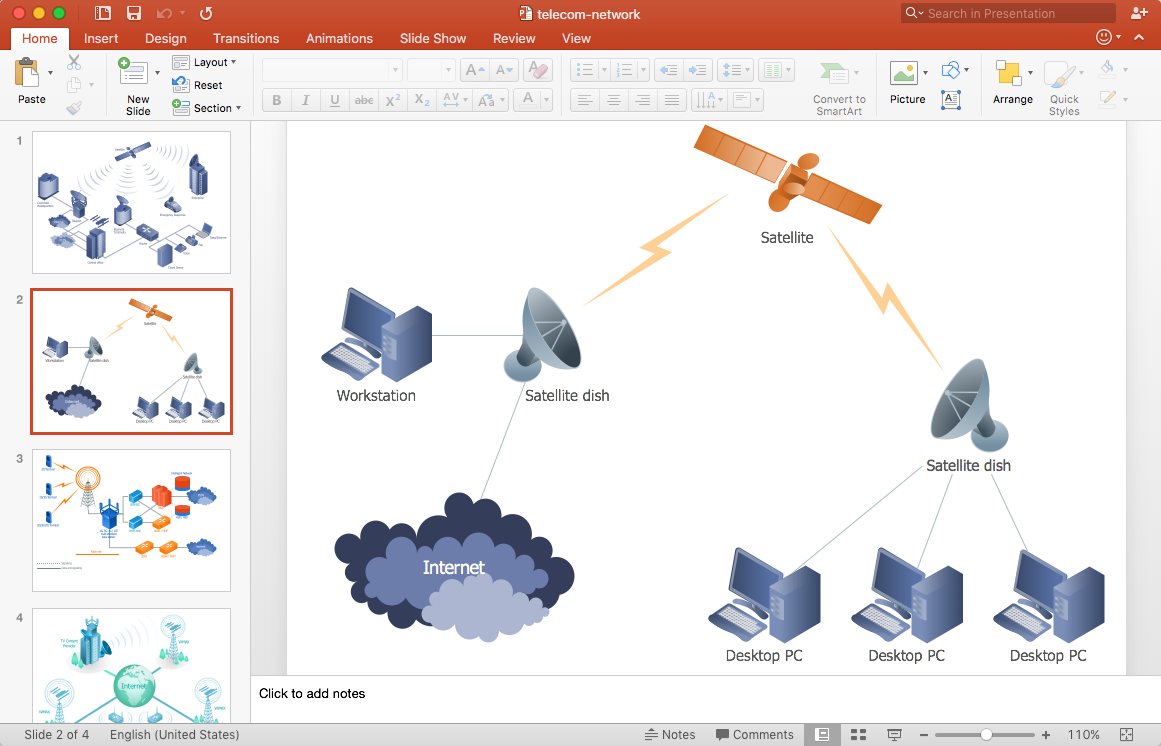
How to Add a Telecommunication Network Diagram to a PowerPoint Presentation
Telecommunication network diagram represents a system consisting of computers, servers, telecommunication devices, switches, satellites, wireless transmitters, antennas, cables, etc., that link a set of remote nodes. It is also describes a telephone exchange, that connects calls between landlines. ConceptDraw PRO allows you to easily create telecommunication network diagrams and then make a PowerPoint Presentation from your network documentation in a few clicks. Telecommunication network diagrams are used to show components and connections in a telecommunications network: how they are interacted between each other and with end-users. The PowerPoint presentation on concept of telecom network can be very informative and helpful. ConceptDraw PRO allows you to make a MS PowerPoint Presentation from your telecommunication network diagrams in a few clicks.- Convert Dfd To Erd
- Data Flow Diagrams
- Context Diagram Template | DFD Library System | Data Flow ...
- Data Flow Diagram | UML Tool & UML Diagram Examples | JSD ...
- DFD - Model of small traditional production enterprise
- Data Flow Diagram Symbols. DFD Library
- System Context Diagram Visio
- Data Flow Diagram | Process Flowchart | Software and Database ...
- Example of DFD for Online Store ( Data Flow Diagram ) DFD ...
- Dfd Diagram Of File Converter
- DFD Library System | Context Diagram Template | IDEF0 Diagrams ...
- Context Diagram Template
- Gane Sarson Diagram | DFD , Gane-Sarson notation - Vector stencils ...
- Data Flow Diagrams | Context Diagram Template | Example of DFD ...
- DFD Library System | Data Flow Diagram Symbols. DFD Library ...
- DFD Library System | Data Flow Diagram Symbols. DFD Library ...
- Context Diagram Template | Process Flowchart | Audiovisual system ...
- DFD Library System | Data Flow Diagrams | Example of DFD for ...
- Data Flow Diagram Of Billing System
- DFD Library System | Data Flow Diagram Symbols. DFD Library ...
- ERD | Entity Relationship Diagrams, ERD Software for Mac and Win
- Flowchart | Basic Flowchart Symbols and Meaning
- Flowchart | Flowchart Design - Symbols, Shapes, Stencils and Icons
- Flowchart | Flow Chart Symbols
- Electrical | Electrical Drawing - Wiring and Circuits Schematics
- Flowchart | Common Flowchart Symbols
- Flowchart | Common Flowchart Symbols


