Process Flowchart


This example of business infographics was designed on the base of flowchart in the webpage "Establishing Operations in an Environmental Protection Park" from the website of Taiwan Department of Investment Services, Ministry of Economic Affairs.
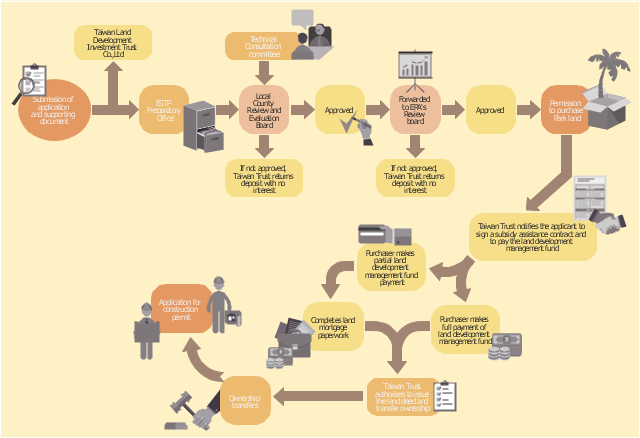
"Upon registration of the company, the "Guideline for Operation and Management of Environmental Science and Technology Park Promotion Program" and "Guideline for Execution of Subsidies for Environmental Science and Technology Park Promotion Program" shall be followed for applying for admission to the Park. Any foreigner who wishes to invest in and build a factory in the Park shall apply to the local Preparatory Office of ESTP for admission approval. It will take approximately two months to secure such approval from the application submission date. The investment and construction application procedures prescribed by preparatory Office of ESTP in Southern Taiwan are shown below for reference." [investtaiwan.nat.gov.tw/ eng/ show.jsp?ID=123&MID=2]
The infographics example "Investment and construction application procedures" was created using the ConceptDraw PRO diagramming and vector drawing software extended with the HR Flowcharts solution from the Management area of ConceptDraw Solution Park.
Flowchart infographics
Types of Flowchart - Overview


Example of Flowchart Diagram

Flow chart Example. Warehouse Flowchart

Standard warehousing process flow diagram and standard workflow diagram used for process identification for further evaluating effectiveness and profitability of overall business process. Use the ConceptDraw PRO diagramming and vector drawing software extended with the Flowcharts solution from the Diagrams area of ConceptDraw Solution Park to design your own workflow diagrams, process flow diagram and flow charts. Need to use Process Flow Diagram for designing Warehouse packages flow.

Flow Chart Diagram Examples

The Flowcharts Solution for ConceptDraw PRO is a comprehensive set of examples and samples in several different color themes for professionals that need to graphically represent a process.
 HR Flowcharts
Human resource management diagrams show recruitment models, the hiring process and human resource development of human resources.
How to Create a Process Flowchart

Fishbone Diagram Procedure

Basic Diagramming


Flowcharting Software

Flowchart design. Flowchart symbols, shapes, stencils and icons

Mavericks have always desired to stand apart and gorgeous design is the recipe for that. Any business graphic document will be more understandable if will use an expository color scheme for their parts. Flowchart design makes versatile presenting and explaining of the process and gives a fresh view that distinguishes it from black and white flowcharts on a paper. Workflow diagram or process flow diagrams become more understandable to ordinary people when it use minimum symbols and special signs.
The best design can be accomplished by starting from any of the suitable Conceptdraw examples. Pick one of them and begin to input proper text into each Flowchart symbols and shapes. Apply less colors in the document and don't turn into rainbow your diagram, three or four will be enough, also note that business process flowchart may not contain bright color hues. The next clue is to use identical colors for same flowchart shape types.

Cause and Effect Diagram

Create a Flow Chart

ConceptDraw PRO is the only professional diagramming software that works on both Windows and Macintosh platforms. All its documents and libraries are 100% compatible and can be exchanged hassle-free between the platforms.
How Do Fishbone Diagrams Solve Manufacturing Problems

ConceptDraw PRO application extended with Fishbone Diagrams solution lets you construct Fishbone diagrams and represent globally recognized standards for manufacturing 6 Ms and 8 Ms.
- Process Flowchart | Investment and construction application ...
- Data Flow Diagram | Construction Procedure Of A Flowline
- Process Flowchart | Organizational Charts with ConceptDraw PRO ...
- Procedure Flow Chart Construction Activity Pdf
- Sample Construction Process Workflow
- Data Flow Diagram | Process Flowchart | Data Flow Diagrams ...
- Process Flowchart | Flow Chart Diagram Examples | Example of ...
- Procedure Of Construction Of Data Flow Diagram
- Construction Project Chart Examples | How To Show Project ...
- Steps In The Construction Of A Flowline Map
- Process Flowchart | Types of Flowchart - Overview | Excellent ...
- Construction Project Chart Examples | Process Flowchart | Types of ...
- Flow Chart For Disciplinary Procedures
- Process Flowchart | Synthetic object construction - Flowchart | Flow ...
- Process Flowchart | Flow Chart Diagram Examples | Example of ...
- Synthetic object construction - Flowchart | Process Flowchart ...
- Describe The Concept And Procedure Used In Construction Dfd S
- Construction Company Business Process Diagram
- Construction Project Management Process Flow Chart
- Construction Company Process Flow Chart
- ERD | Entity Relationship Diagrams, ERD Software for Mac and Win
- Flowchart | Basic Flowchart Symbols and Meaning
- Flowchart | Flowchart Design - Symbols, Shapes, Stencils and Icons
- Flowchart | Flow Chart Symbols
- Electrical | Electrical Drawing - Wiring and Circuits Schematics
- Flowchart | Common Flowchart Symbols
- Flowchart | Common Flowchart Symbols