Best Tool for Infographic Construction

Map Infographic Tool

Spatial Infographics

Infographic Tools

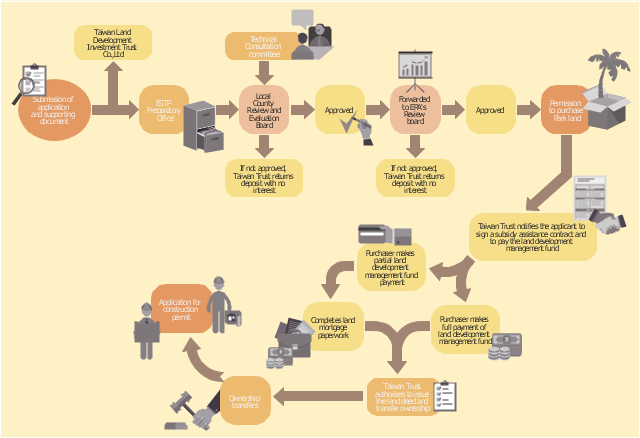
This example of business infographics was designed on the base of flowchart in the webpage "Establishing Operations in an Environmental Protection Park" from the website of Taiwan Department of Investment Services, Ministry of Economic Affairs.
"Upon registration of the company, the "Guideline for Operation and Management of Environmental Science and Technology Park Promotion Program" and "Guideline for Execution of Subsidies for Environmental Science and Technology Park Promotion Program" shall be followed for applying for admission to the Park. Any foreigner who wishes to invest in and build a factory in the Park shall apply to the local Preparatory Office of ESTP for admission approval. It will take approximately two months to secure such approval from the application submission date. The investment and construction application procedures prescribed by preparatory Office of ESTP in Southern Taiwan are shown below for reference." [investtaiwan.nat.gov.tw/ eng/ show.jsp?ID=123&MID=2]
The infographics example "Investment and construction application procedures" was created using the ConceptDraw PRO diagramming and vector drawing software extended with the HR Flowcharts solution from the Management area of ConceptDraw Solution Park.
Flowchart infographics
Travel Infographics

This example of business infographics was designed on the base of flowchart in the webpage "Establishing Operations in an Environmental Protection Park" from the website of Taiwan Department of Investment Services, Ministry of Economic Affairs.
"Upon registration of the company, the "Guideline for Operation and Management of Environmental Science and Technology Park Promotion Program" and "Guideline for Execution of Subsidies for Environmental Science and Technology Park Promotion Program" shall be followed for applying for admission to the Park. Any foreigner who wishes to invest in and build a factory in the Park shall apply to the local Preparatory Office of ESTP for admission approval. It will take approximately two months to secure such approval from the application submission date. The investment and construction application procedures prescribed by preparatory Office of ESTP in Southern Taiwan are shown below for reference." [investtaiwan.nat.gov.tw/ eng/ show.jsp?ID=123&MID=2]
The infographics example "Investment and construction application procedures" was created using the ConceptDraw PRO diagramming and vector drawing software extended with the HR Flowcharts solution from the Management area of ConceptDraw Solution Park.
"Upon registration of the company, the "Guideline for Operation and Management of Environmental Science and Technology Park Promotion Program" and "Guideline for Execution of Subsidies for Environmental Science and Technology Park Promotion Program" shall be followed for applying for admission to the Park. Any foreigner who wishes to invest in and build a factory in the Park shall apply to the local Preparatory Office of ESTP for admission approval. It will take approximately two months to secure such approval from the application submission date. The investment and construction application procedures prescribed by preparatory Office of ESTP in Southern Taiwan are shown below for reference." [investtaiwan.nat.gov.tw/ eng/ show.jsp?ID=123&MID=2]
The infographics example "Investment and construction application procedures" was created using the ConceptDraw PRO diagramming and vector drawing software extended with the HR Flowcharts solution from the Management area of ConceptDraw Solution Park.
Flowchart infographics
Excellent Examples of Infographic Maps

3 Circle Venn. Venn Diagram Example

Map Infographic Creator

Information Graphics

Pictorial Chart

Spatial infographics Design Elements: Location Map

 What are Infographic Area
Solutions of the area What is Infographics from ConceptDraw Solution Park collect templates, samples and vector stencils libraries with design elements for the drawing information graphics.
- Best Tool for Infographic Construction | Map Infographic Tool | Travel ...
- Best Tool for Infographic Construction | How to draw Metro Map style ...
- Map Infographic Maker | Transportation Infographics | Best Tool for ...
- Best Tool for Infographic Construction | Map Infographic Maker ...
- Best Tool for Infographic Construction | Spatial infographics Design ...
- How to Add Data-driven Infographics to a MS Word Document Using ...
- Best Tool for Infographic Construction | Transportation Infographics ...
- Travel Infographics | Best Tool for Infographic Construction ...
- Best Tool for Infographic Construction | Infographic Tools | Spatial ...
- Best Tool for Infographic Construction | Road Transport - Design ...
- Road Transport - Design Elements | Transportation Infographics ...
- Infographic Maker | Map Infographic Maker | Best Tool for ...
- Best Tool for Infographic Construction | Infographic Maker | Map ...
- Spatial infographics Design Elements: Continental Map | Best Tool ...
- Transportation Infographics | Travel Infographics | Best Tool for ...
- Pictures of Vegetables | Food Images | Best Tool for Infographic ...
- Best Tool for Infographic Construction | Spatial infographics Design ...
- Construction Project Chart Examples | Process Flowchart | Best Tool ...
- Best Tool for Infographic Construction | How to Add Data-driven ...
- How To Create a MS Visio Data-driven Infographics Using ...
- ERD | Entity Relationship Diagrams, ERD Software for Mac and Win
- Flowchart | Basic Flowchart Symbols and Meaning
- Flowchart | Flowchart Design - Symbols, Shapes, Stencils and Icons
- Flowchart | Flow Chart Symbols
- Electrical | Electrical Drawing - Wiring and Circuits Schematics
- Flowchart | Common Flowchart Symbols
- Flowchart | Common Flowchart Symbols