HelpDesk
How to Track Your Project Plan vs. the Actual Project Condition

How can you illustrate the weather condition

The vector stencils library "DFD, Yourdon and Coad notation" contains 22 DFD elements.
Use it for drawing data flow diagrams (DFD) using Yourdon/ DeMarco notation in the ConceptDraw PRO diagramming and vector drawing software extended with the Data Flow Diagrams solution from the Software Development area of ConceptDraw Solution Park.
Use it for drawing data flow diagrams (DFD) using Yourdon/ DeMarco notation in the ConceptDraw PRO diagramming and vector drawing software extended with the Data Flow Diagrams solution from the Software Development area of ConceptDraw Solution Park.
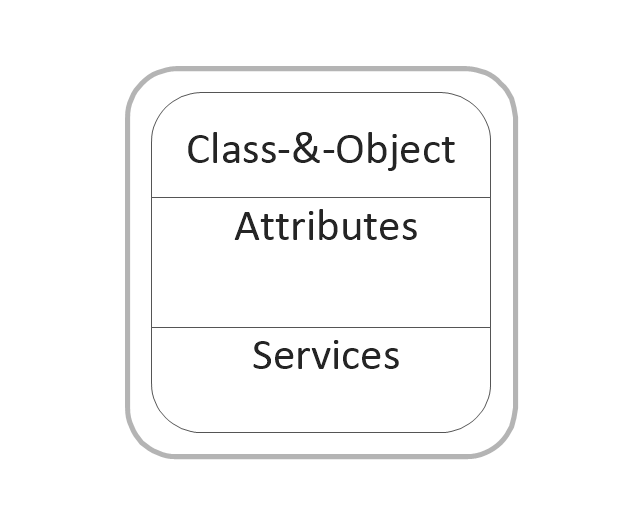
Class and object
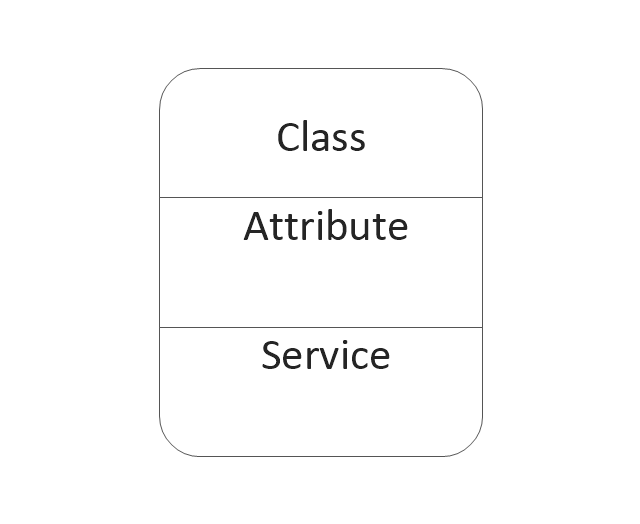
Class
Object state
Generalization and specialization structure
Whole-part structure
Condition
Loop
External interactor
Data process
Multiple process
State
Multi-state
Stop state

Stop state2
Process
Process (offset)
-dfd,-yourdon-and-coad-notation---vector-stencils-library.png--diagram-flowchart-example.png)
Center to center
Center to center #2
Loop on center
Data store
Instance

Message

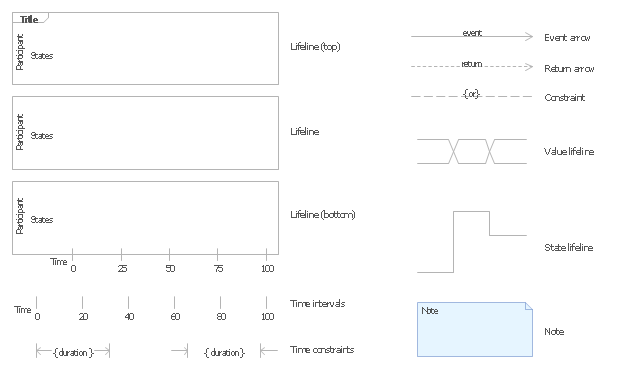
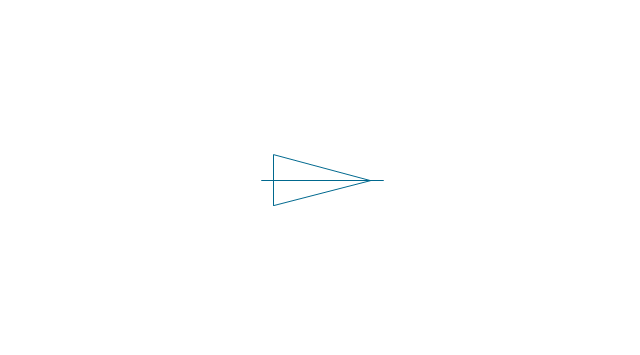
The vector stencils library "UML timing diagrams" contains 15 symbols for the ConceptDraw PRO diagramming and vector drawing software.
"The following nodes and edges are typically drawn in a UML timing diagram: lifeline, state or condition timeline, destruction event, duration constraint, time constraint. ...
Lifeline is a named element which represents an individual participant in the interaction. ... lifelines represent only one interacting entity. ...
Lifeline on the timing diagrams is represented by the name of classifier or the instance it represents. It could be placed inside diagram frame or a "swimlane". ...
Timing diagram could show states of the participating classifier or attribute, or some testable conditions, such as a discrete or enumerable value of an attribute. ...
UML also allows the state/ condition dimension be continuous. It could be used in scenarios where entities undergo continuous state changes, such as temperature or density. ...
Destruction occurrence is a message occurrence which represents the destruction of the instance described by the lifeline. It may result in the subsequent destruction of other objects that this object owns by composition. No other occurrence may appear after the destruction event on a given lifeline.
Complete UML name of the occurrence is destruction occurrence specification. Until UML 2.4 it was called destruction event, and earlier - stop.
The destruction event is depicted by a cross in the form of an X at the end of a timeline. ...
Duration constraint is an interval constraint that refers to a duration interval. The duration interval is duration used to determine whether the constraint is satisfied.
The semantics of a duration constraint is inherited from constraints. If constraints are violated, traces become negative which means that system is considered as failed.
Duration constraint is shown as some graphical association between a duration interval and the constructs that it constrains. ...
Time constraint is an interval constraint that refers to a time interval. The time interval is time expression used to determine whether the constraint is satisfied.
The semantics of a time constraint is inherited from constraints. All traces where the constraints are violated are negative traces, i.e., if they occur, the system is considered as failed.
Time constraint is shown as graphical association between a time interval and the construct that it constrains. Typically this graphical association is a small line, e.g., between an occurrence specification and a time interval." [uml-diagrams.org/ timing-diagrams.html]
The example "Design elements - UML timing diagrams" is included in the Rapid UML solution from the Software Development area of ConceptDraw Solution Park.
UML timing diagram symbols
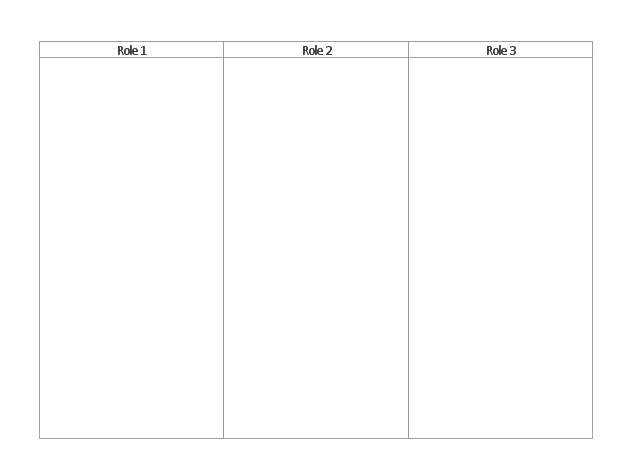
The vector stencils library "Cross-functional flowcharts" contains 31 flow chart symbols. Use it for drawing cross-functional and deployment flowcharts the ConceptDraw PRO diagramming and vector drawing software extended with the Cross-Functional Flowcharts solution from the Business Processes area of ConceptDraw Solution Park.
Swimlanes Vertical
Swimlanes Horizontal
Terminator

Process

Decision

Yes
No
YES/NO
Data

Manual Operation

Document

Predefined Process

Stored Data

Internal Storage
Sequential Data

Direct Data
Manual Input

Card

Paper Tape

Display
Preparation

Parallel Mode

Loop limit

On-page Reference

Off-Page Reference (Outgoing)
-cross-functional-flowcharts---vector-stencils-library.png--diagram-flowchart-example.png)
Off-Page Reference (Incoming)
-cross-functional-flowcharts---vector-stencils-library.png--diagram-flowchart-example.png)
Off-page Reference (Circle)
-cross-functional-flowcharts---vector-stencils-library.png--diagram-flowchart-example.png)
Off-Page Reference (Arrow)
-cross-functional-flowcharts---vector-stencils-library.png--diagram-flowchart-example.png)
Annotation
Control Transfer
Condition
Basic Flowchart Symbols and Meaning


The vector stencils library "Cross-functional flowcharts" contains 31 flow chart symbols. Use it for drawing cross-functional and deployment flowcharts the ConceptDraw PRO diagramming and vector drawing software extended with the Cross-Functional Flowcharts solution from the Business Processes area of ConceptDraw Solution Park.
Swimlanes Vertical
Swimlanes Horizontal
Terminator
Process
Decision
Yes
No
YES/NO
Data
Manual Operation
Document
Predefined Process
Stored Data
Internal Storage
Sequential Data
Direct Data
Manual Input
Card
Paper Tape
Display
Preparation
Parallel Mode
Loop limit
On-page Reference
Off-Page Reference (Outgoing)
Off-Page Reference (Incoming)
Off-page Reference (Circle)
Off-Page Reference (Arrow)
Annotation
Control Transfer
Condition
The vector stencils library "DFD, Yourdon and Coad notation" contains 22 DFD elements.
Use it for drawing data flow diagrams (DFD) using Yourdon/ DeMarco notation in the ConceptDraw PRO diagramming and vector drawing software extended with the Data Flow Diagrams solution from the Software Development area of ConceptDraw Solution Park.
Use it for drawing data flow diagrams (DFD) using Yourdon/ DeMarco notation in the ConceptDraw PRO diagramming and vector drawing software extended with the Data Flow Diagrams solution from the Software Development area of ConceptDraw Solution Park.
Class and object
Class
Object state
Generalization and specialization structure
Whole-part structure
Condition
Loop
External interactor
Data process
Multiple process
State
Multi-state
Stop state
Stop state2
Process
Process (offset)
Center to center
Center to center #2
Loop on center
Data store
Instance
Message
The vector stencils library "Audit flowcharts" contains 31 flow chart symbols.
Use it in accounting, financial management, fiscal information tracking, money management, decision making, and financial inventories to create auditing flowchart diagrams in the ConceptDraw PRO diagramming and vector drawing software extended with the Audit Flowcharts solution from the Finance and Accounting area of ConceptDraw Solution Park.
www.conceptdraw.com/ solution-park/ finance-audit-flowcharts
Tagged Process

Tagged Document

Decision

Manual operation

Terminator

Manual File

Display

On-page reference

Off-page reference

Divided (Table View)
-audit-flowcharts---vector-stencils-library.png--diagram-flowchart-example.png)
Process

Lined / shaded process

Lined Document

Document

Database

Disk Storage

Floppy disk

Magnetic Tape

Data Transmission

Manual input

Check 1 (audit)
-audit-flowcharts---vector-stencils-library.png--diagram-flowchart-example.png)
Compare 1

Reference point

Check 2 (audit)
-audit-flowcharts---vector-stencils-library.png--diagram-flowchart-example.png)
Compare 2

Event

Entity (Rounded Corners)
-audit-flowcharts---vector-stencils-library.png--diagram-flowchart-example.png)
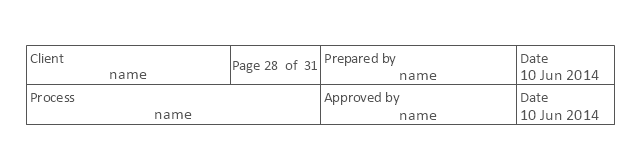
Title Block
Condition

Input/ Output

Delay

IDEF9 Standard

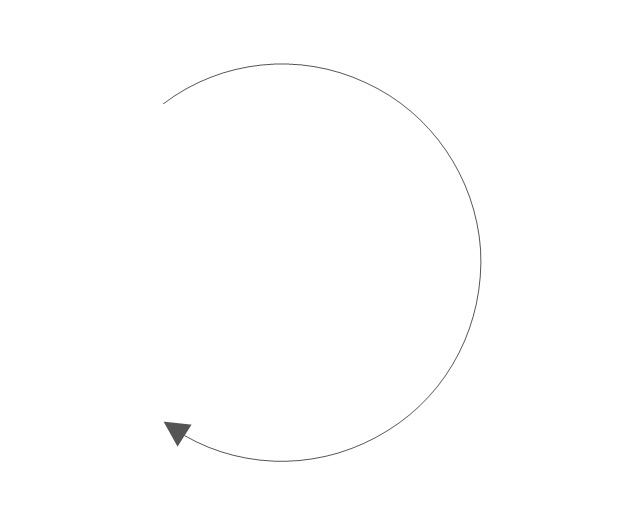
This circular arrows diagram sample depicts the Plan–Do–Check–Act cycle.
"PDCA (plan–do–check–act or plan–do–check–adjust) is an iterative four-step management method used in business for the control and continuous improvement of processes and products. It is also known as the Deming circle/ cycle/ wheel, Shewhart cycle, control circle/ cycle, or plan–do–study–act (PDSA). Another version of this PDCA cycle is OPDCA. The added "O" stands for observation or as some versions say "Grasp the current condition." This emphasis on observation and current condition has currency with Lean manufacturing/ Toyota Production System literature." [PDCA. Wikipedia]
The diagram example "PDCA cycle" was created using the ConceptDraw PRO diagramming and vector drawing software extended with the Circular Arrows Diagrams solution from the area "What is a Diagram" of ConceptDraw Solution Park.
Circular arrows diagram

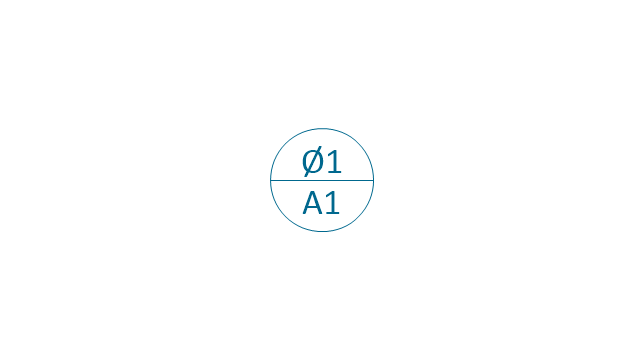
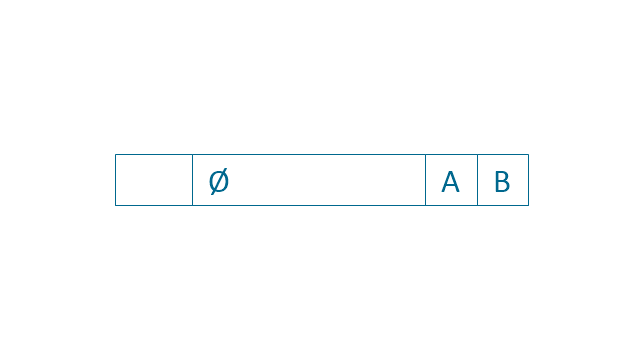
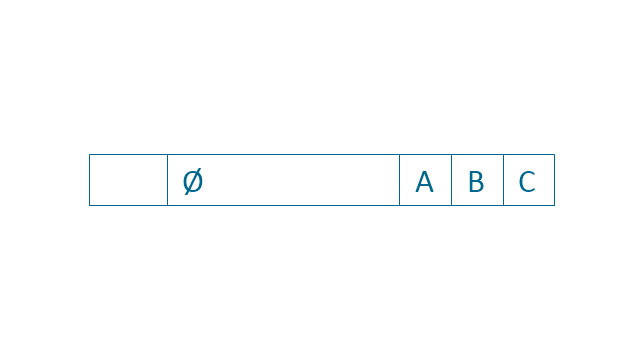
The vector stencils library "Dimensioning and tolerancing" contains 45 symbols of geometric dimensions and mechanical tolerances, geometric symbols, callouts, and text boxes and inserts.
Use these geometric dimensioning and tolerancing (GD&T) shapes to create annotated mechanical drawings in the ConceptDraw PRO diagramming and vector drawing software extended with the Mechanical Engineering solution from the Engineering area of ConceptDraw Solution Park.
www.conceptdraw.com/ solution-park/ engineering-mechanical
Datum (old)
-dimensioning-and-tolerancing---vector-stencils-library.png--diagram-flowchart-example.png)
Box callout
Datum symbol
Callout

All around callout

Text block

2 datum frame
Simple frame

Basic frame

1 datum frame

3 datum frame
Straightness

Flatness

Line profile

Circularity

Cylindricity

Surface profile

Position

Concentricity

Symmetry

Parallelism

Perpendicularity

Angularity

Material condition

Arc length

Diameter

Counterbore/ spotface

Countersink

Depth

Slope
Conical taper
Statistical tolerance

Datum (new)
-dimensioning-and-tolerancing---vector-stencils-library.png--diagram-flowchart-example.png)
Datum (new) 2
-2-dimensioning-and-tolerancing---vector-stencils-library.png--diagram-flowchart-example.png)
Target point
Target line
Target area (circle)
-dimensioning-and-tolerancing---vector-stencils-library.png--diagram-flowchart-example.png)
Target area (rectangle)
-dimensioning-and-tolerancing---vector-stencils-library.png--diagram-flowchart-example.png)
Total runout

Total runout 2

Circular runout

Circular runout 2

Surface finish

Surface finish, removal process

Surface finish, no process permitted

This TQM diagram example was redesigned from the illustration of the Highway Performance Monitoring System (HPMS) Field Manual from the website of the Federal Highway Administration (FHWA).
[fhwa.dot.gov/ policyinformation/ hpms/ fieldmanual/ chapter7.cfm]
"Highway Performance Monitoring System (HPMS).
The HPMS is a national level highway information system that includes data on the extent, condition, performance, use and operating characteristics of the nation's highways. The HPMS contains administrative and extent of system information on all public roads, while information on other characteristics is represented in HPMS as a mix of universe and sample data for arterial and collector functional systems. Limited information on travel and paved miles is included in summary form for the lowest functional systems.
HPMS was developed in 1978 as a continuing database, replacing the special biennial condition studies that had been conducted since 1965. The HPMS has been modified several times since its inception. Changes have been made to reflect changes in the highway systems, legislation, and national priorities, to reflect new technology, and to consolidate or streamline reporting requirements." [fhwa.dot.gov/ policyinformation/ hpms.cfm]
The TQM flowchart example "Software workflow diagram" was created using the ConceptDraw PRO diagramming and vector drawing software extended with the Total Quality Management (TQM) Diagrams solution from the Quality area of ConceptDraw Solution Park.
TQM diagram

Flowchart

Finite State Machine

FSM — Finite-state Machine

HelpDesk
How to Customize a Task’s Duration

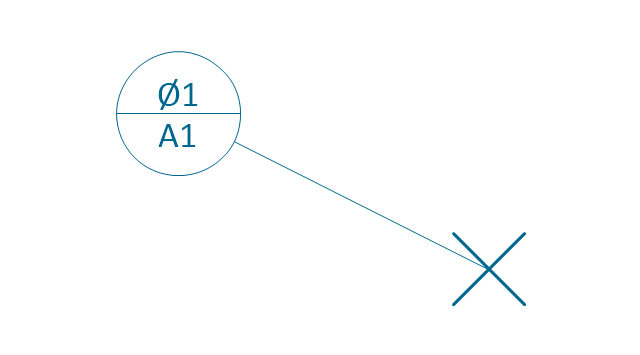
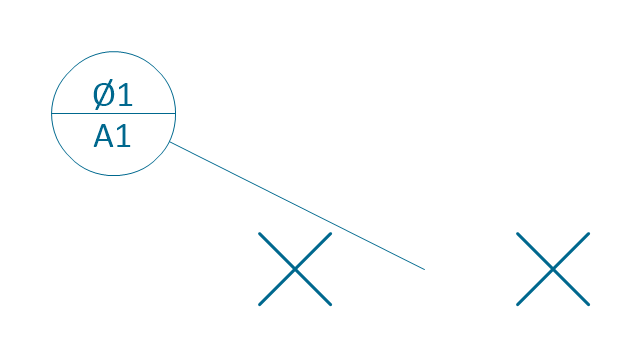
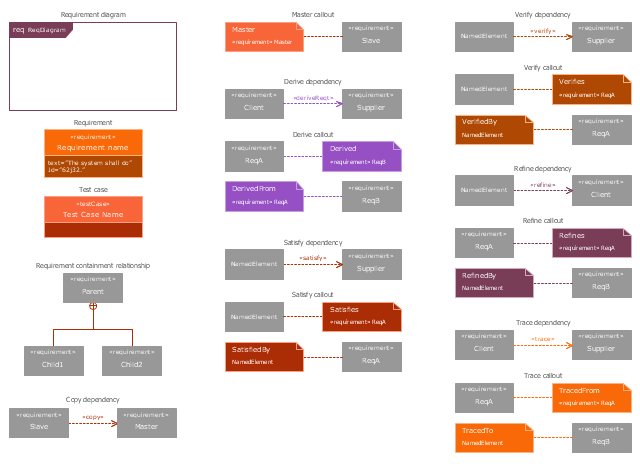
The vector stencils library "Requirement diagram" contains 21 SysML symbols.
Use it to design your requirement diagrams using ConceptDraw PRO diagramming and vector drawing software.
"A requirement specifies a capability or condition that must (or should) be satisfied. A requirement may specify a function that a system must perform or a performance condition a system must achieve. SysML provides modeling constructs to represent text-based requirements and relate them to other modeling elements. The requirements diagram described in this clause can depict the requirements in graphical, tabular, or tree structure format. A requirement can also appear on other diagrams to show its relationship to other modeling elements. The requirements modeling constructs are intended to provide a bridge between traditional requirements management tools and the other SysML models.
A requirement is defined as a stereotype of UML Class subject to a set of constraints. A standard requirement includes properties to specify its unique identifier and text requirement. Additional properties such as verification status, can be specified by the user.
Several requirements relationships are specified that enable the modeler to relate requirements to other requirements as well as to other model elements. These include relationships for defining a requirements hierarchy, deriving requirements, satisfying requirements, verifying requirements, and refining requirements." [www.omg.org/ spec/ SysML/ 1.3/ PDF]
The SysML shapes example "Design elements - Requirement diagram" is included in the SysML solution from the Software Development area of ConceptDraw Solution Park.
SysML requirement diagram symbols
This vector stencils library contains 10 SysML symbols.
Use it to design your use case diagrams using ConceptDraw PRO diagramming and vector drawing software.
"A use case diagram at its simplest is a representation of a user's interaction with the system that shows the relationship between the user and the different use cases in which the user is involved. A use case diagram can identify the different types of users of a system and the different use cases and will often be accompanied by other types of diagrams as well." [Use case diagram. Wikipedia]
The vector stencils library "Use case diagram" is included in the SysML solution from the Software Development area of ConceptDraw Solution Park.
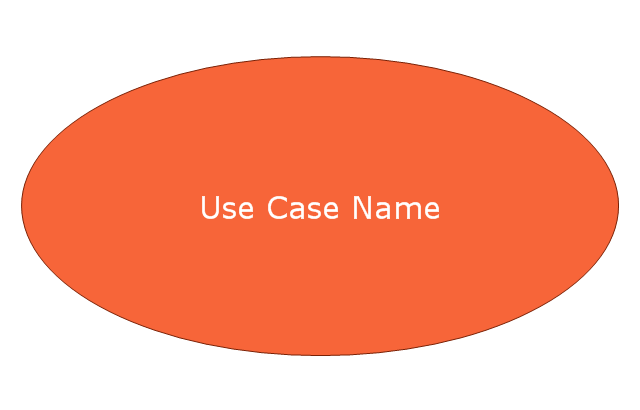
Use case
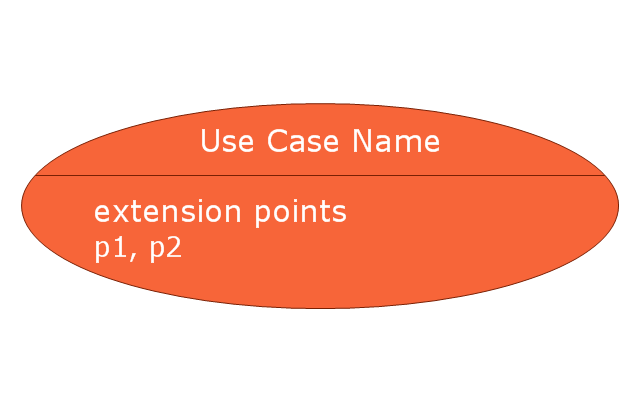
Use case with extension points
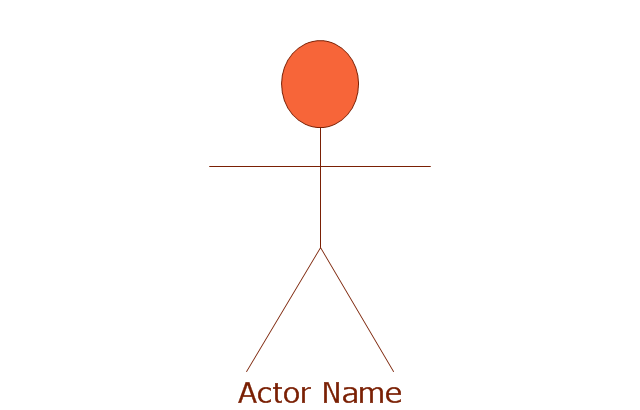
Actor
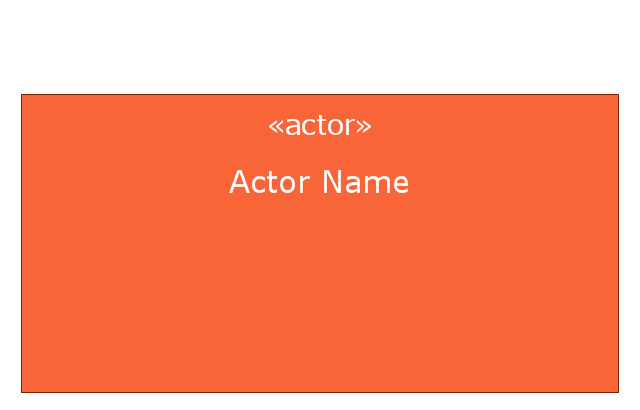
Actor 2
Subject

Communication path

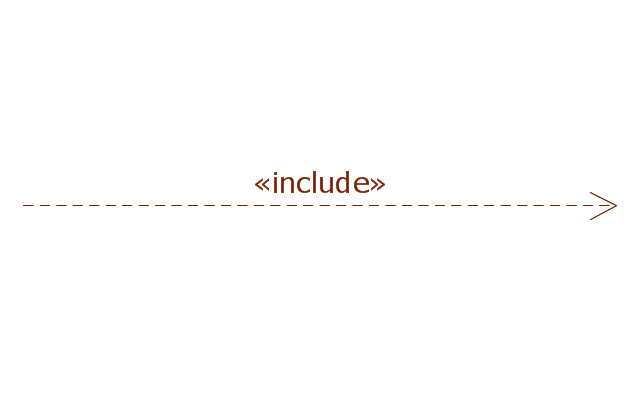
Include
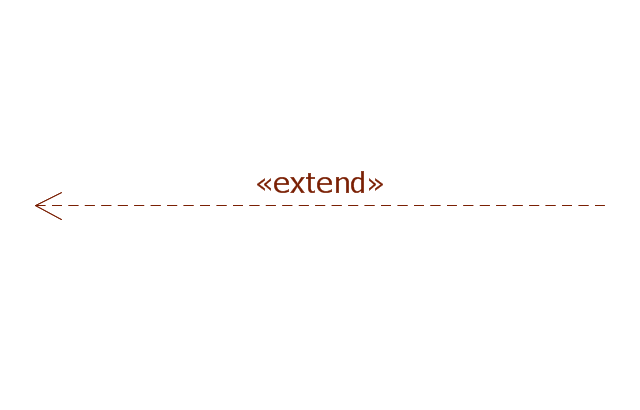
Extend
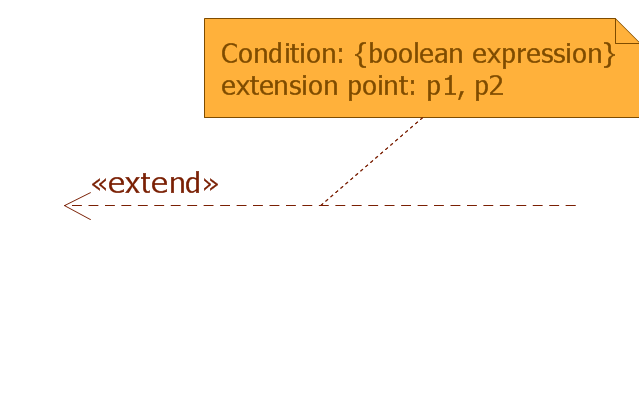
Extend with condition
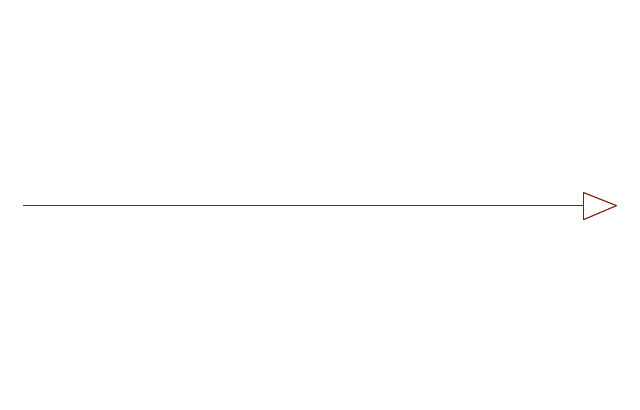
Generalization
The vector stencils library "Fault tree analysis diagrams" contains 12 symbols for drawing Fault Tree Analysis (FTA) diagrams.
"Fault tree analysis (FTA) is a top down, deductive failure analysis in which an undesired state of a system is analyzed using Boolean logic to combine a series of lower-level events. This analysis method is mainly used in the fields of safety engineering and reliability engineering to understand how systems can fail, to identify the best ways to reduce risk or to determine (or get a feeling for) event rates of a safety accident or a particular system level (functional) failure. FTA is used in the aerospace, nuclear power, chemical and process, pharmaceutical, petrochemical and other high-hazard industries; but is also used in fields as diverse as risk factor identification relating to social service system failure.
In aerospace, the more general term "system Failure Condition" is used for the "undesired state" / Top event of the fault tree. These conditions are classified by the severity of their effects. The most severe conditions require the most extensive fault tree analysis. These "system Failure Conditions" and their classification are often previously determined in the functional Hazard analysis." [Fault tree analysis. Wikipedia]
The shapes example "Fault tree analysis diagrams" was created using the ConceptDraw PRO diagramming and vector drawing software extended with the Fault Tree Analysis Diagrams solution from the Engineering area of ConceptDraw Solution Park.
FTA diagram symbols

- How can you illustrate the weather condition | IVR services diagram ...
- How can you illustrate the weather condition | Nature | Illustration ...
- How can you illustrate the weather condition | Nature Clipart and ...
- How can you illustrate the weather condition | Nature | Design ...
- How to Track Your Project Plan vs. the Actual Project Condition ...
- How to Track Your Project Plan vs. the Actual Project Condition ...
- How to Track Your Project Plan vs. the Actual Project Condition ...
- Workflow diagram - Weather forecast | How can you illustrate the ...
- Drawing Illustration | Nature | How can you illustrate the weather ...
- Design elements - Data Flow Diagram (DFD) | How to Create ...
- Block Diagram Of Air Condition Control System
- Nature | How can you illustrate the weather condition | Illustration ...
- Nature | Drawing Illustration | How can you illustrate the weather ...
- Condition
- Condition
- Design elements - Weather | Nature Clipart and Illustrations ...
- Condition In Swimlane Diagram
- Fault Tree Analysis Diagrams
- Circular arrows diagram - PDCA cycle
- UML timing diagram - Template | Diagramming Software for Design ...
- ERD | Entity Relationship Diagrams, ERD Software for Mac and Win
- Flowchart | Basic Flowchart Symbols and Meaning
- Flowchart | Flowchart Design - Symbols, Shapes, Stencils and Icons
- Flowchart | Flow Chart Symbols
- Electrical | Electrical Drawing - Wiring and Circuits Schematics
- Flowchart | Common Flowchart Symbols
- Flowchart | Common Flowchart Symbols