Modelling Concepts for Business Engineering - EPC

ConceptDraw DIAGRAM - software that reduces the time needed to create a business process model.
 Bubble Diagrams
Bubble diagrams have enjoyed great success in software engineering, architecture, economics, medicine, landscape design, scientific and educational process, for ideas organization during brainstorming, for making business illustrations, presentations, planning, design, and strategy development. They are popular because of their simplicity and their powerful visual communication attributes.
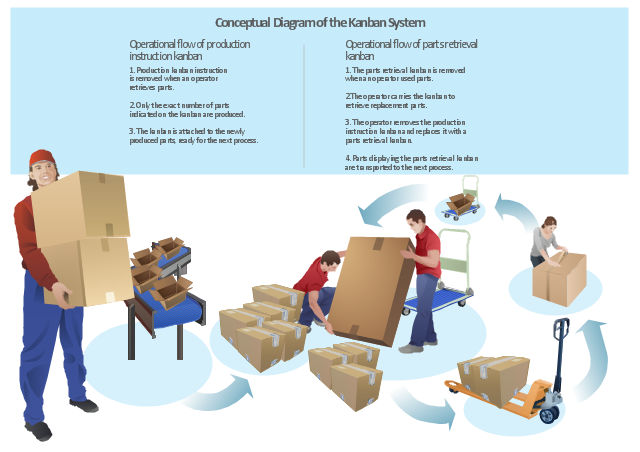
"Kanban ... (literally signboard or billboard) is a scheduling system for lean and just-in-time (JIT) production. Kanban is a system to control the logistical chain from a production point of view, and is not an inventory control system. Kanban was developed by Taiichi Ohno, at Toyota, to find a system to improve and maintain a high level of production. Kanban is one method through which JIT is achieved.
Kanban became an effective tool in support of running a production system as a whole, and it proved to be an excellent way for promoting improvement. Problem areas were highlighted by reducing the number of kanban in circulation." [Kanban. Wikipedia]
The example "Conceptual diagram of the Kanban System" was created in the ConceptDraw PRO diagramming and vector drawing software using the vector stencils library Packaging, loading, customs.
The example "Conceptual diagram of the Kanban System" is included in the Manufacturing and Maintenance solution from the Illustration area of ConceptDraw Solution Park.
Infographics


 Circular Arrows Diagrams
Circular Arrows Diagrams solution extends ConceptDraw DIAGRAM with extensive drawing tools, predesigned samples, Circular flow diagram template for quick start, and a library of ready circular arrow vector stencils for drawing Circular Arrow Diagrams, Segmented Cycle Diagrams, and Circular Flow Diagrams. The elements in this solution help managers, analysts, business advisers, marketing experts, scientists, lecturers, and other knowledge workers in their daily work.
What Is a Concept Map

HelpDesk
How To Create a Concept Map in Visio

How To Make a Concept Map

Bubble diagrams in Landscape Design with ConceptDraw DIAGRAM

Entity Relationship Diagram Symbols

ERD symbols used for professional ERD drawing are collected in libraries from the Entity-Relationship Diagram (ERD) solution for ConceptDraw DIAGRAM.
- Conceptual diagram of the Kanban System | Manufacturing and ...
- Conceptual diagram of the Kanban System | Gambar Area Diagram
- Gambar Conceptual Diagram Of The Kanban System Toyota
- Conceptual Diagram Of Network Security
- Tool To Draw Conceptual Model
- Conceptual diagram of the Kanban System | Management Tools ...
- Conceptual diagram of the Kanban System | Business - Workflow ...
- Diagram Marketing Concept
- Conceptual diagram of the Kanban System | Kanban Board ...
- Architecture Concept Diagram Software
- ERD | Entity Relationship Diagrams, ERD Software for Mac and Win
- Flowchart | Basic Flowchart Symbols and Meaning
- Flowchart | Flowchart Design - Symbols, Shapes, Stencils and Icons
- Flowchart | Flow Chart Symbols
- Electrical | Electrical Drawing - Wiring and Circuits Schematics
- Flowchart | Common Flowchart Symbols
- Flowchart | Common Flowchart Symbols