ConceptDraw Arrows10 Technology
You want to connecting objects manually?You don't know how should diagramming software work?
Is it possible to develop a diagram as quickly as the ideas come to you?
Yes. The innovative ConceptDraw Arrows10 Technology - This is more than enough versatility to draw any type of diagram with any degree of complexity.
You can start draw your diagram manually now.
HelpDesk
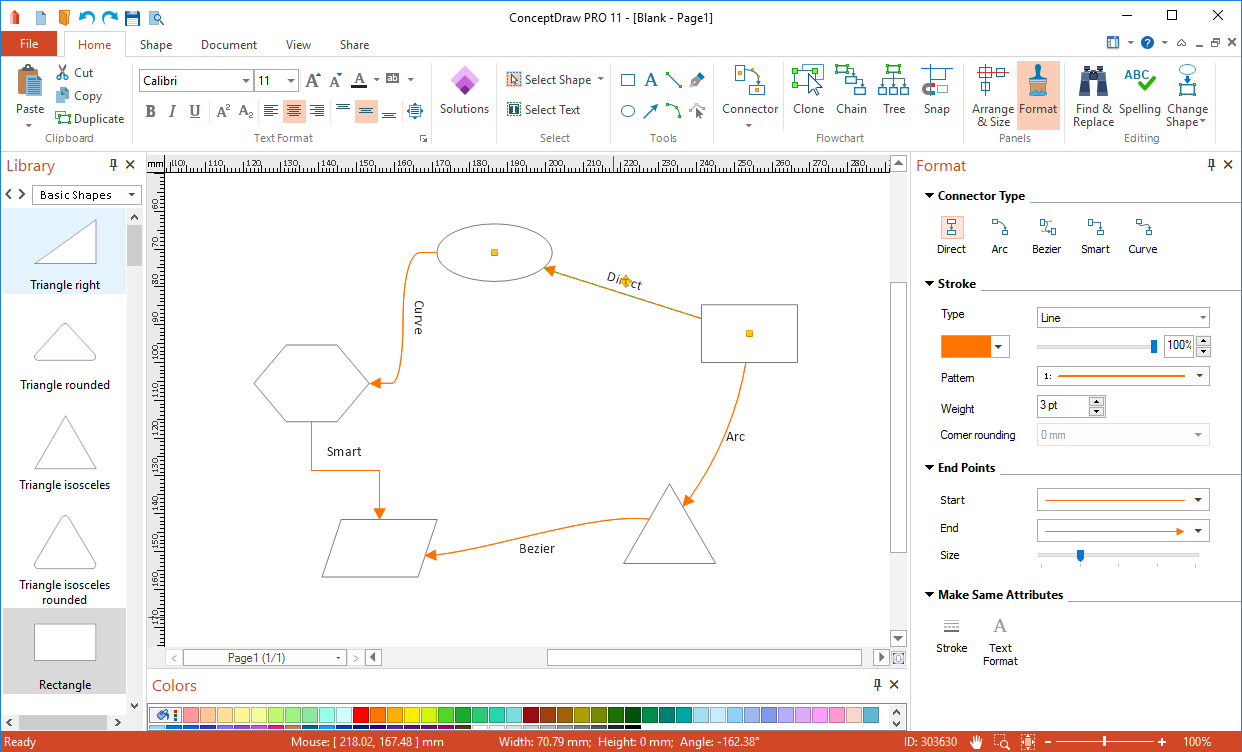
How to Connect Objects on PC
ConceptDraw PRO provides a few options for drawing connections between objects: Direct Connectors,Smart, Arc, Bezier, Curve and Round Connectors. You can connect objects in your ConceptDraw diagram with proper connectors using the embedded automatic connection modes. This article describes how you can connect objects with connectors and how you can ascribe different types and behaviors.

HelpDesk
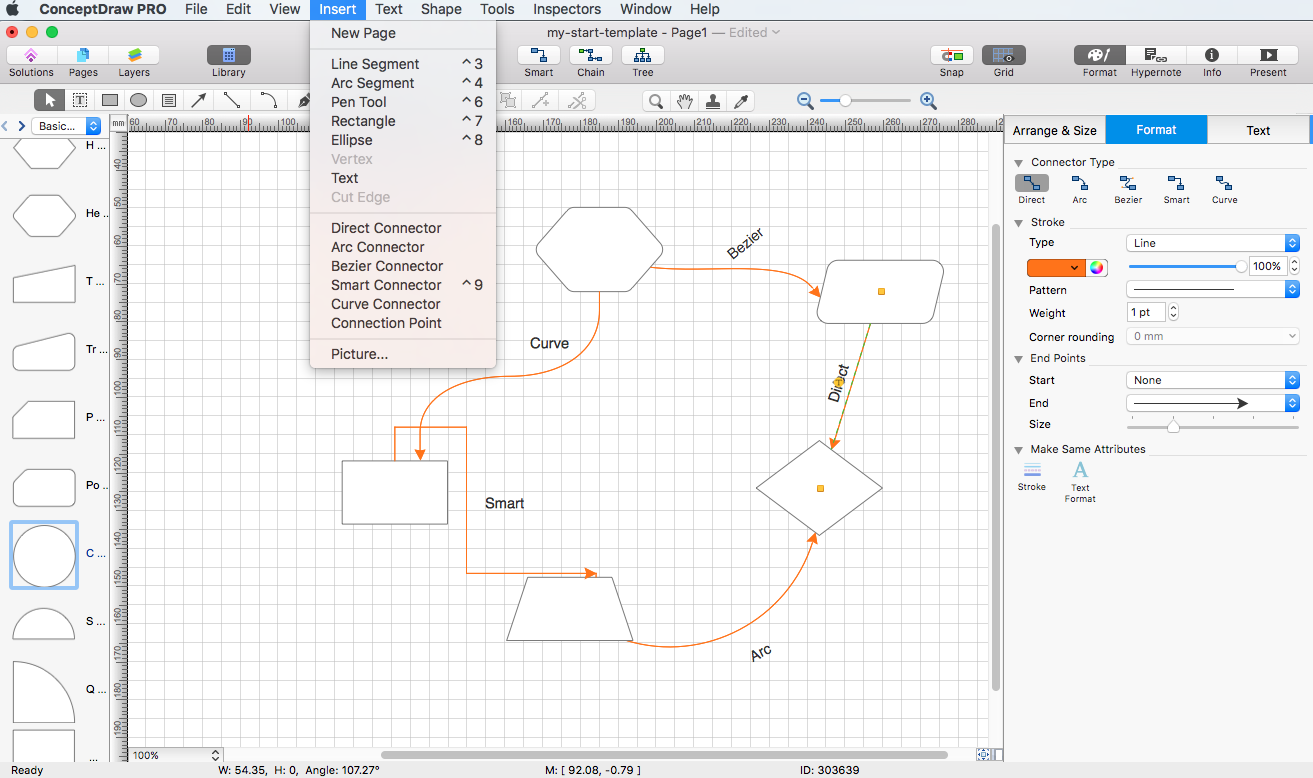
How to Connect Objects on Mac
ConceptDraw PRO provides a few options for drawing connections between. This article describes how you can connect objects with connectors and how you can ascribe different types and behaviors.
HelpDesk
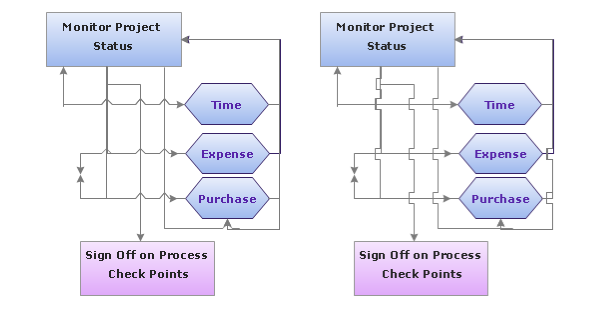
How to Set Line Jumps for Smart Connectors in ConceptDraw PRO
Connecting objects in ConceptDraw PRO is an easy task. You can use Chain, or Tree connection mode for automatic connection of multiple objects. Besides the automatic connection modes, ConceptDraw PRO offers few options to connect objects manually: Direct, Arc, Bezier, Smart, Curve and Round Connectors. You can make them square, arched or angled and also set vertical or horizontal orientation Thus, you can control how the jumps and orientation occurs on smart connectors. When two smart connectors cross each other you can control how the two intersecting lines look.Bubble diagrams with ConceptDraw PRO
Using ConceptDraw you will be able to create bubble diagrams from the ready ConceptDraw library objects or make your own objects. The created diagram can be saved and edited, objects can be moved and links between them will be automatically repainted after object moving because of using the ConceptDraw connectors.HelpDesk
How to Create a Time Series Dashboard
Time Series Dashboard means an integration of some type of diagrams: Line Charts, Bar Charts, Column Charts, and Dot Plots on a single space. The ConceptDraw Time Series Dashboard solution can be used to create the interactive Time Series dashboard. The libraries of Time Series Charts solution contain the Live Objects, that can change their appearance depending on the external data. Each chart from the Time Series dashboard displays particular source data. You can include Time Series Charts in your business or technical dashboards to show and compare the items changing over time.HelpDesk
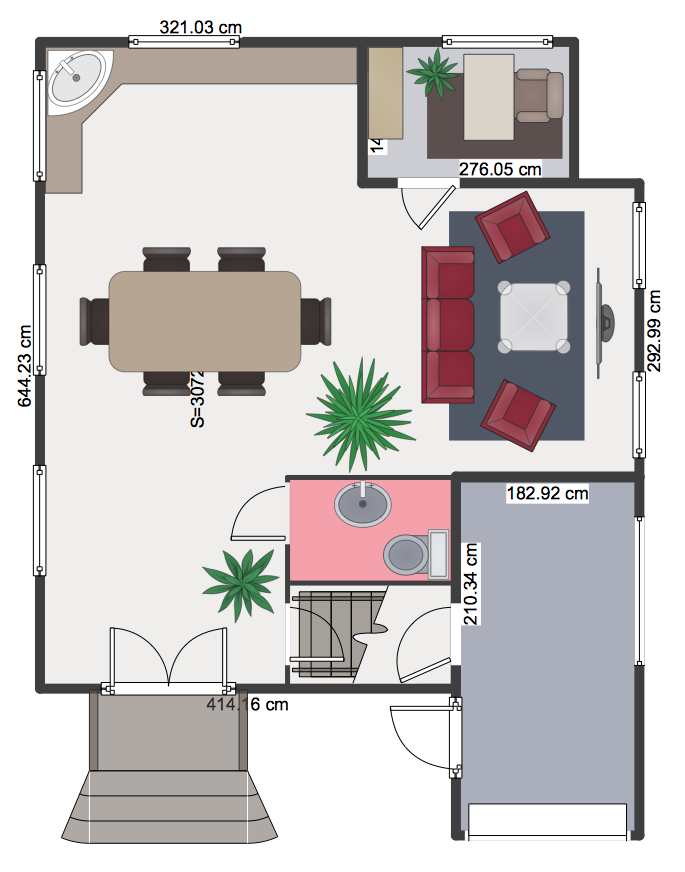
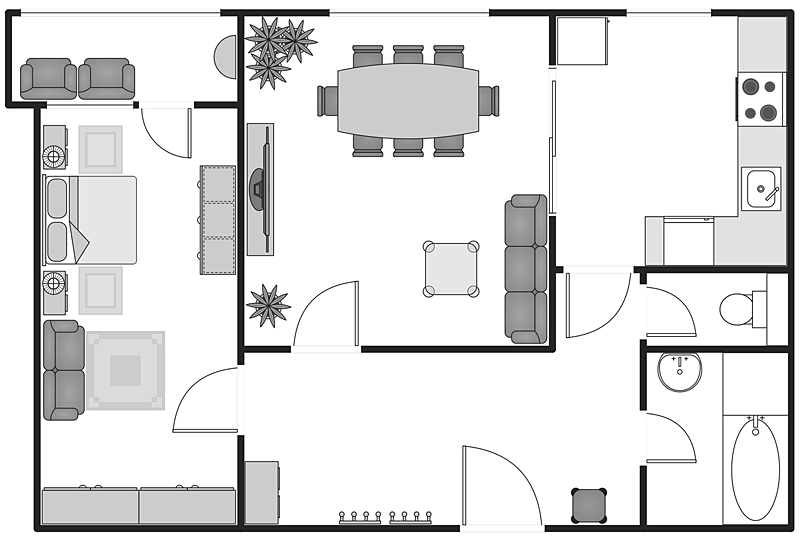
How to Create a Floor Plan
Making a floor plan is the best way to get a handle on how to organize your living space, and find out what could be changed. Creating a floor plan to scale is a challenge of the home and interior design process and can be noticeably helpful for visualizing things like furniture layout. You can use ConceptDraw?PRO to?produce layouts of?real estate properties. ConceptDraw PRO contains the large quantity of pre-designed vector objects that you can use for quick and easy designing such floor plans. You ?can easily determine the?size of?the?rooms and distances in?you drawing. The?ability to?create a floor plan is?delivered by?the?Floor Plans?solution. This solution extends ConceptDraw PRO with libraries that contains over 500 objects of floor plan elements. There is?a set of?special objects that?displays the?sizes, corners, squares and other technical details using?the?current measurements?of?units.ConceptDraw Arrows10 Technology
Connecting objects manually in ConceptDraw PRO is a snap:- points;
- Connecting groups of objects;
- Auto-routing;
- Connectors text;
- Snap to Guides ;
- Quick.
Basic Flowchart Symbols and Meaning
Flowchart Symbols and Meaning - Provides a visual representation of basic flowchart symbols and their proposed use in professional workflow diagram, standard process flow diagram and communicating the structure of a well-developed web site, as well as their correlation in developing on-line instructional projects. See flowchart's symbols by specifics of process flow diagram symbols and workflow diagram symbols.
HelpDesk
How to Connect a Live Object to a Text Data Source
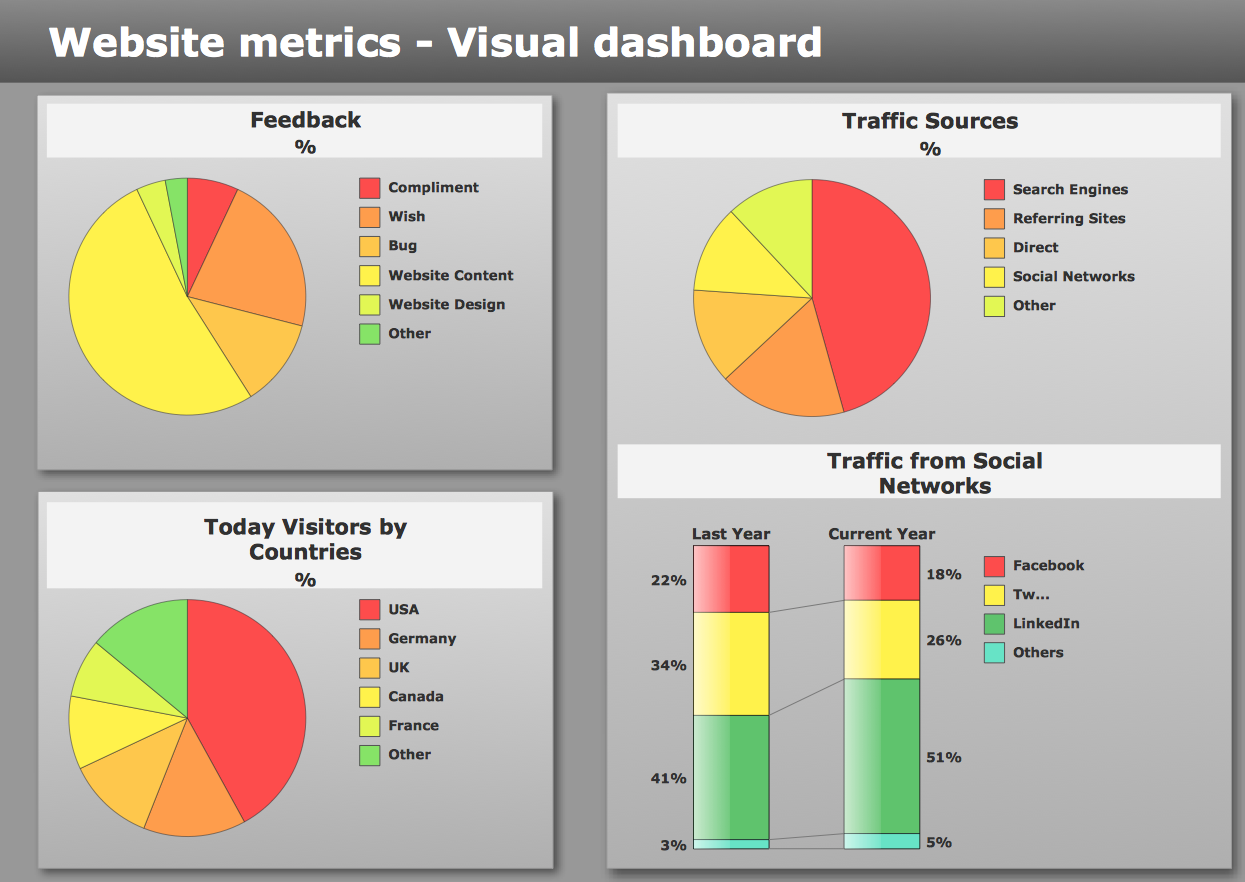
You can easily create a visual dashboard using charts and graphic indicators from Live Objects libraries. Here is an instruction on how to connect a ConceptDraw live object with data source files in TXT format to visualize the actual values of your performance metrics.ConceptDraw Arrows10 Technology
You can see that when you rotate a group, connectors change their angle, keeping their position inside of the grouped objects. If you decide to ungroup the objects, the connectors will adjust to keep lines parallel to the edges of the sheet.The magic of ConceptDraw Arrows10’s rotating group containing connectors, makes complex diagramming simple and easy.
The way to connect objects has never been easier.
HelpDesk
How to Diagram Sentences in ConceptDraw PRO
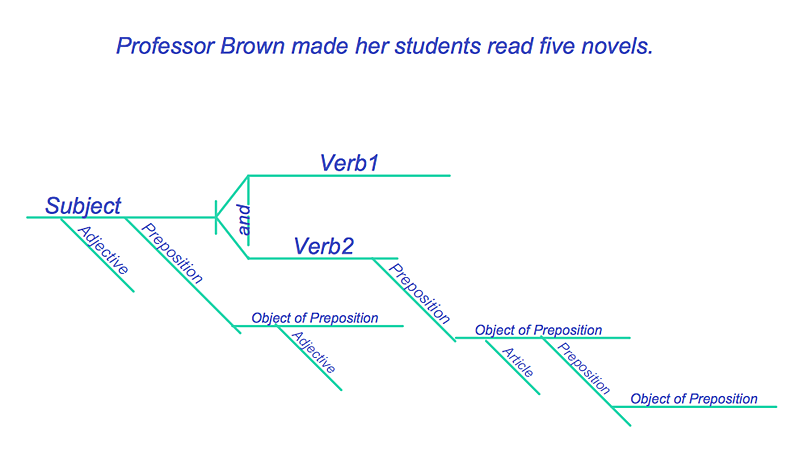
Diagramming sentences is a playful, fun way to learning English Grammer. Sentences can be very complex, and can contain many different parts of speech which implicate many different grammatical rules. Diagramming sentences will help you to make sure every parts of your sentence are grammatically correct, and provides you with more comprehensive understanding of the English Language. A Sentence Diagram displays the parts of a sentence as a diagram in order to show the relationship of words and groups of words within the sentence. Sentence Diagram shows the relationship between the proposal of its parts. This is a good way to teach grammar! Sentence Diagram helps to make the writing more coherent as well as more interesting to read. ConceptDraw PRO allows you to create clear sentence diagrams using the special templates and vector stencils library.HelpDesk
How to Create a Meter Dashboard
ConceptDraw Meter Dashboard solution is design to support creating interactive indicator such as Gauges, Meters, Bullets and Sliders. It is based on a Live Object technology. Live Meters indicators are used to show various types of quantitative data, and can be arranged into a dashboard. The dashboard displays the actual data from the data source files with regular updates every 5 seconds.HelpDesk
How to Add a Concept Map to a PowerPoint Presentation
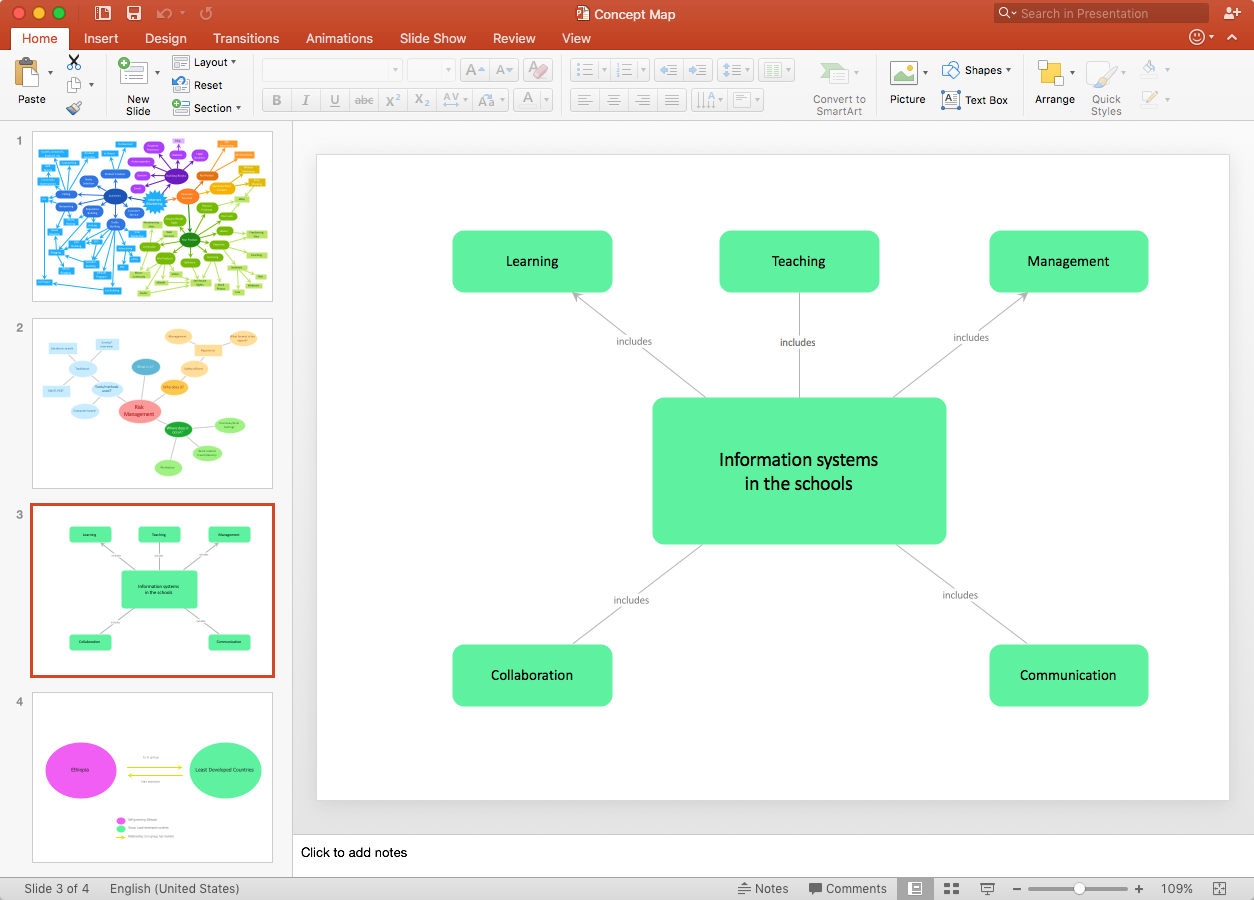
Concept maps visually present the relationships among a set of a logically connected items. ConceptDraw PRO allows you to draw concept maps using the Concept Map solution. The PowerPoint presentation of key concept points can be very informative and helpful.HelpDesk
How to Create a Building Plan Using ConceptDraw PRO
Making a detailed floor plan involves many different elements. Whether it is a home, office, business center, restaurant, shop store, or any other building type. Without the basic plan a building project. The basic floor plan is assurance of correct implementation of architectural ideas, engineering, and design solutions. The basic building and floor planning can be managed using ConceptDraw PRO. The ability to design different floor plans is delivered by the basic Floor Plans solution. Using this solution you can easily create and communicate building plans of any complexity and purposes.- Conceptdraw Connection Line With Object
- How to Connect Objects in ConceptDraw PRO on PC | How to Set ...
- How to Connect Objects in ConceptDraw PRO on PC | How to ...
- How to Connect Objects in ConceptDraw PRO on PC | How to ...
- How to Connect Objects in ConceptDraw PRO on PC | How to Set ...
- How to Connect Objects in ConceptDraw PRO on PC ...
- How to Connect Objects in ConceptDraw PRO on PC
- How to Set Line Jumps for Smart Connectors in ConceptDraw PRO ...
- How to Set Line Jumps for Smart Connectors in ConceptDraw PRO ...
- Line Chart Examples | Line Graph | What Is a Line Chart | Samples ...
- How to Connect a Live Object to a Text Data Source | How to ...
- How To Create CCTV Network Diagram | Line Graphs ...
- Bubble diagrams with ConceptDraw PRO | How to Create a Bubble ...
- How to Connect Text Data to a Time Series Chart on Your Live ...
- Basketball Court Dimensions | How to Set Line Jumps for Smart ...
- ConceptDraw Arrows10 Technology | How to Connect Objects in ...
- Computer and Networks Area | How to Draw a Line Chart Quickly ...
- How to Create a Bubble Diagram Using ConceptDraw PRO | How to ...
- What Makes ConceptDraw PRO the Best Alternative to MS Visio ...
- Completed transition schematic - IDEF3 diagram | Transition ...
- ERD | Entity Relationship Diagrams, ERD Software for Mac and Win
- Flowchart | Basic Flowchart Symbols and Meaning
- Flowchart | Flowchart Design - Symbols, Shapes, Stencils and Icons
- Flowchart | Flow Chart Symbols
- Electrical | Electrical Drawing - Wiring and Circuits Schematics
- Flowchart | Common Flowchart Symbols
- Flowchart | Common Flowchart Symbols

