3D Network Diagram Software

Use more than 2 000 pre-designed 3D network elements for customizing your network diagrams. Computer & Networks solution allows you for design 3D LAN and WAN, schematic and wiring drawings.

 Directional Maps
Directional Maps solution extends ConceptDraw DIAGRAM software with templates, samples and libraries of vector stencils for drawing the directional, location, site, transit, road and route maps, plans and schemes.
HelpDesk
How to Draw a Histogram

3D Network Diagrams. Computer and Network Examples
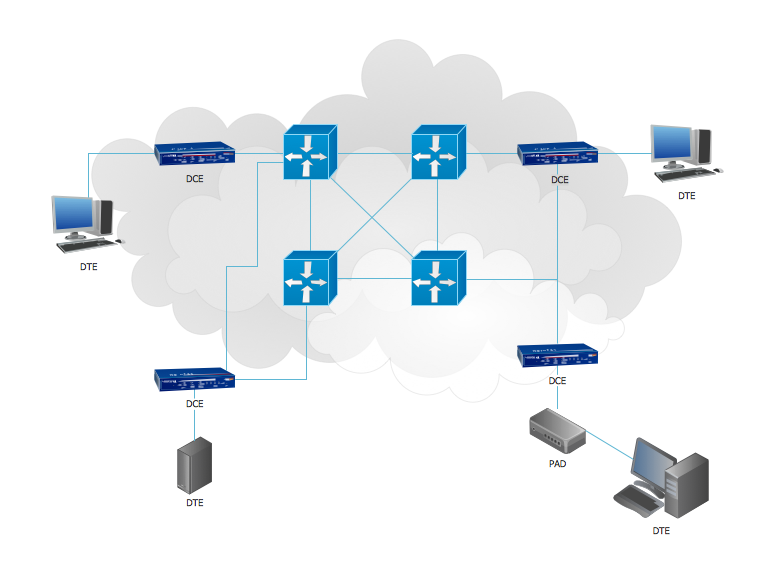
This example shows the 3D Network Diagram. It was created in ConceptDraw DIAGRAM using the 3D network elements from the Computer and Networks solution from the Computer and Networks area of ConceptDraw Solution Park.
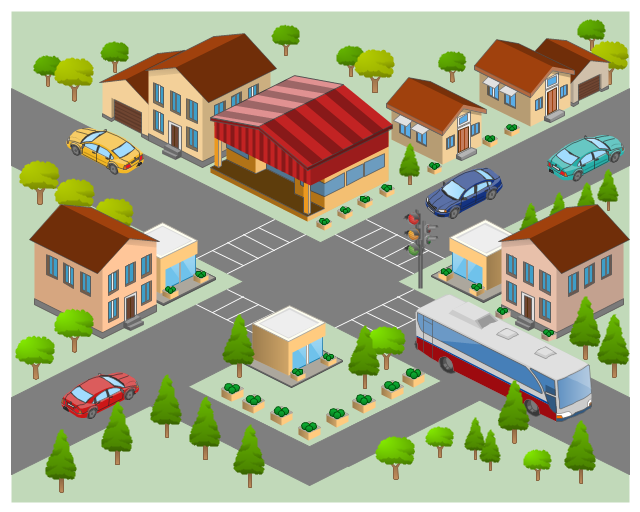
The 3D pictorial street maps are used as road maps, route maps, locator maps, transit maps, directional maps, tourist maps with points of interest (POI).
"A point of interest, or POI, is a specific point location that someone may find useful or interesting. ...
Most consumers use the term when referring to hotels, campsites, fuel stations or any other categories used in modern (automotive) navigation systems. ...
The term is widely used in cartography, especially in electronic variants including GIS, and GPS navigation software. In this context the synonym waypoint is common.
A GPS point of interest specifies, at minimum, the latitude and longitude of the POI, assuming a certain map datum. A name or description for the POI is usually included, and other information such as altitude or a telephone number may also be attached. GPS applications typically use icons to represent different categories of POI on a map graphically." [Point of interest. Wikipedia]
The example "3D pictorial street map" was created using the ConceptDraw PRO diagramming and vector drawing software extended with the Directional Maps solution from the Maps area of ConceptDraw Solution Park.
3D pictorial street map
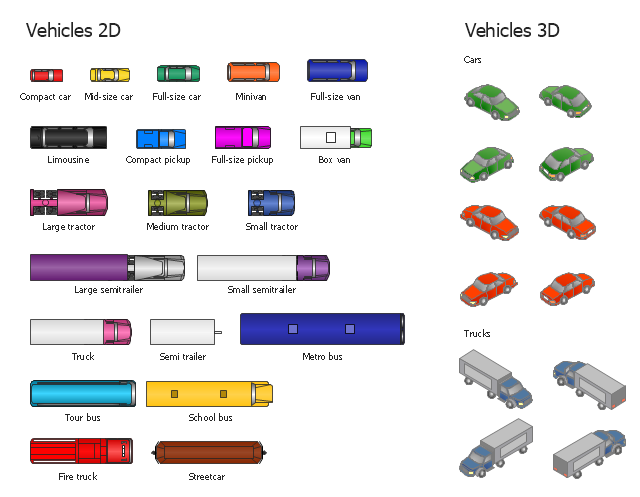
The vector stencils library "Vehicles (2D)" contains 21 icons. The library "Vehicles (3D)" contains 12 icons.
Use these icons for creating the pictorial road and rout maps, directional and locator maps, transit and street maps, road traffic and automotive transport moving diagrams using the ConceptDraw PRO diagramming and vector drawing software.
The example "Design elements - Vehicles 2D, 3D" is included in the Directional Maps solution from the Maps area of ConceptDraw Solution Park.
Vehicle symbols
Pyramid Diagram

3D triangular diagram of DIKW pyramid has 6 levels: measurement, facts, data, information, knowledge, wisdom.
The data component include different scattered signs or symbols which are merely useless until these random objective facts are somehow processed. Data is a resource which has to be manipulated or rearranged to get useful. Information can be extracted from a pile of data, it also can be mined from different data storages.
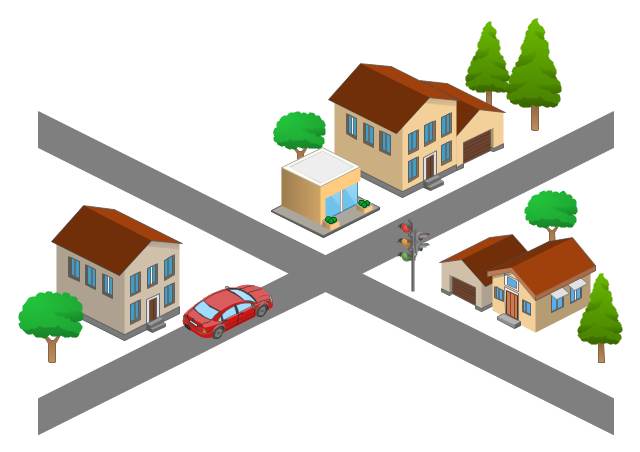
Use this template for creating the 3D pictorial road maps, directional maps, location plans, site plans, transit maps, route maps.
"Road maps can ... vary in complexity, from a simple schematic map used to show how to get to a single specific destination (such as a business), to a complex electronic map, which may layer together many different types of maps and information" [Road map. Wikipedia]
This template for the ConceptDraw PRO diagramming and vector drawing software is included in the Directional Maps solution from the Maps area of ConceptDraw Solution Park.
3D pictorial road map template
The template "6-Level 3D pyramid diagram" for the ConceptDraw PRO diagramming and vector drawing software is included in the Pyramid Diagrams solution from the Marketing area of ConceptDraw Solution Park.
www.conceptdraw.com/ solution-park/ marketing-pyramid-diagrams
www.conceptdraw.com/ solution-park/ marketing-pyramid-diagrams
Pyramid diagram

The 3D vertical bar graph sample shows the Iran internet users per 100 person from 2000 to 2011. It was designed on the base of the Commons Wikimedia file: Iran internet users per 100 person.png.
[commons.wikimedia.org/ wiki/ File:Iran_ internet_ users_ per_ 100_ person.png]
This file is licensed under the Creative Commons Attribution-Share Alike 3.0 Unported license. [creativecommons.org/ licenses/ by-sa/ 3.0/ deed.en]
The data source is World Bank: [data.worldbank.org/ country/ iran-islamic-republic]
"In 1993 Iran became the second country in the Middle East to be connected to the Internet, and since then the government has made significant efforts to improve the nation's ICT infrastructure. Iran's national Internet connectivity infrastructure is based on two major networks: the public switched telephone network (PSTN) and the public data network. The PSTN provides a connection for end-users to Internet service providers (ISPs) over mostly digital lines and supports modem-based connections. The Data Communication Company of Iran (DCI), a subsidiary of TCI, operates the public data network." [Internet in Iran. Wikipedia]
The 3D column chart example "Iran internet users per 100 person" was created using the ConceptDraw PRO diagramming and vector drawing software extended with the Bar Graphs solution from the Graphs and Charts area of ConceptDraw Solution Park.
3D Column chart

- Conceptdraw 3d
- 3D Network Diagram Software | Network Drawing Software ...
- Rack Diagrams | Software House Design 3d
- Design Element: Rack Diagram for Network Diagrams | All 3d Shapes
- Design elements - 3D directional maps | Computer Network ...
- 3D Network Diagram Software
- 3d Buildings Clipart
- Map Network Diagram 3d
- How to Create a Directional Map Using ConceptDraw PRO | 3D ...
- Pyramid Diagrams | Network Diagramming with ConceptDraw PRO ...
- ERD | Entity Relationship Diagrams, ERD Software for Mac and Win
- Flowchart | Basic Flowchart Symbols and Meaning
- Flowchart | Flowchart Design - Symbols, Shapes, Stencils and Icons
- Flowchart | Flow Chart Symbols
- Electrical | Electrical Drawing - Wiring and Circuits Schematics
- Flowchart | Common Flowchart Symbols
- Flowchart | Common Flowchart Symbols