Concept Map Maker
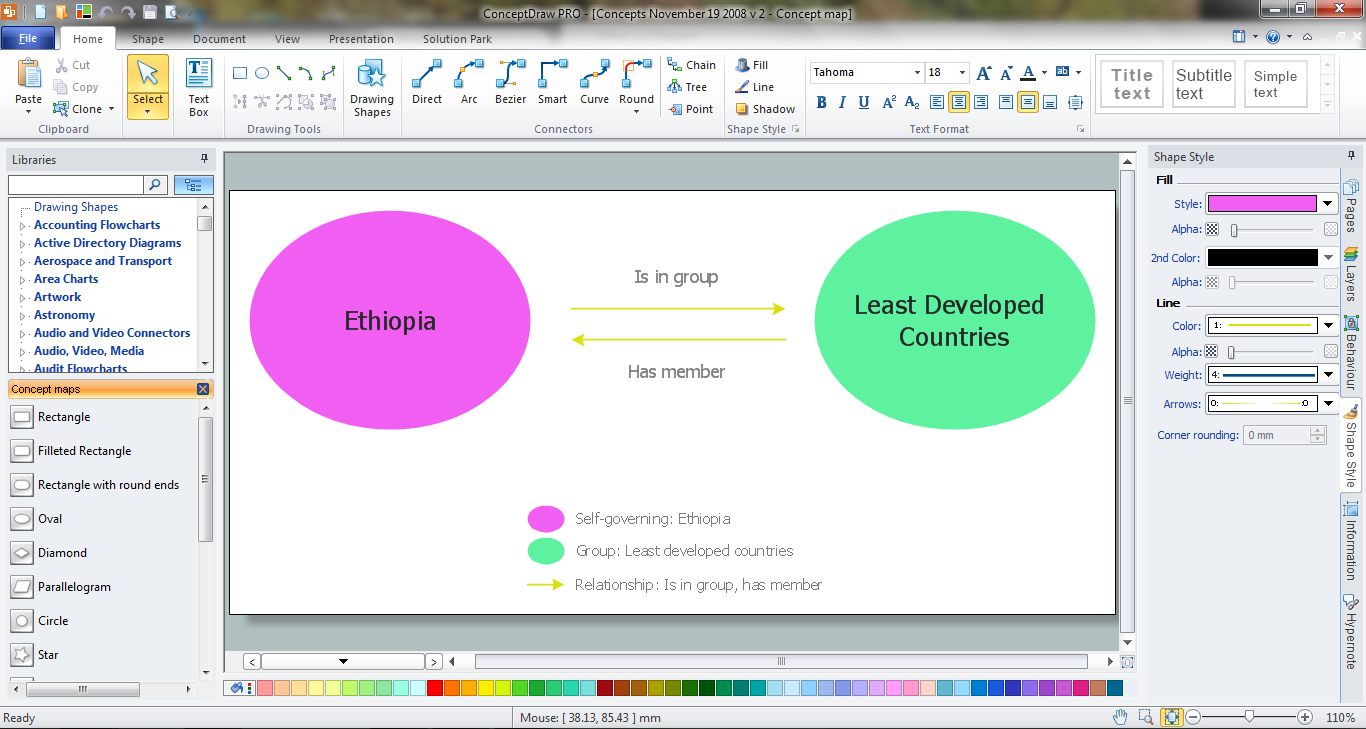
ConceptDraw PRO diagramming and vector drawing software extended with Concept Maps Solution from the "Diagrams" Area is a powerful Concept Map Maker.Mind Map Making Software
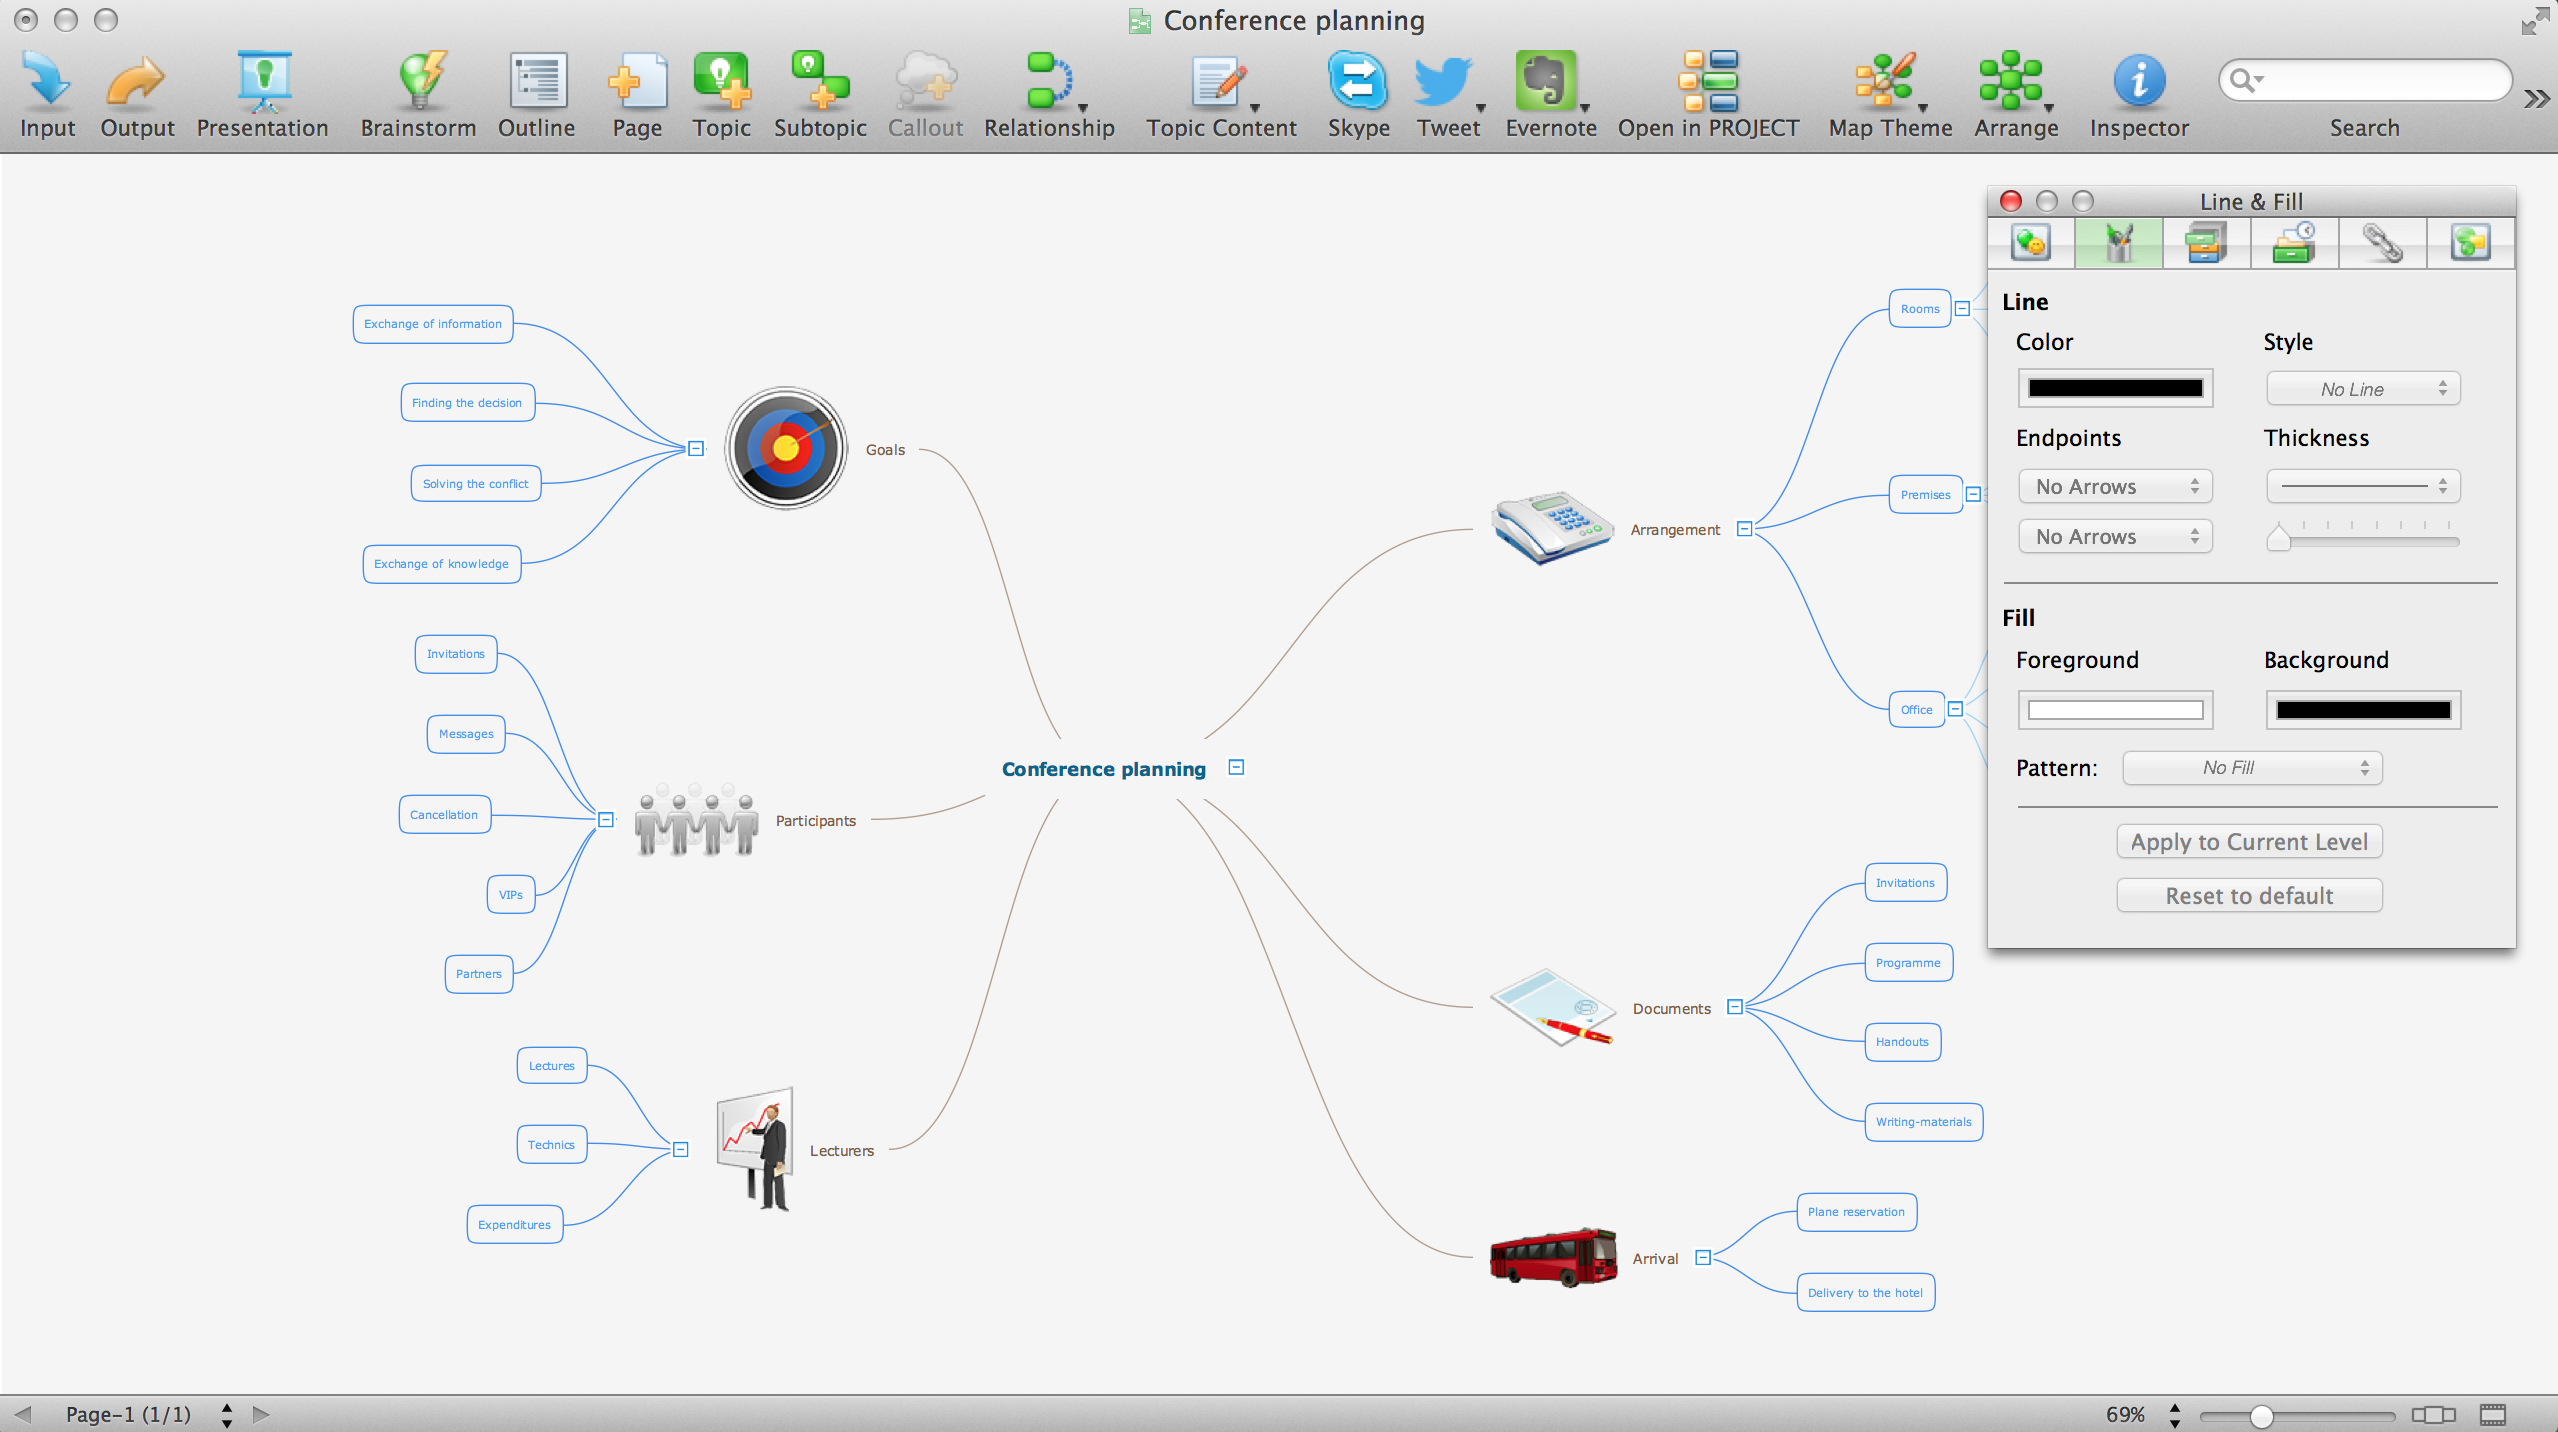
The power, economy, and versatility of ConceptDraw MINDMAP takes personnel and team productivity to another level. Discover today what this means to you.What Is a Concept Map
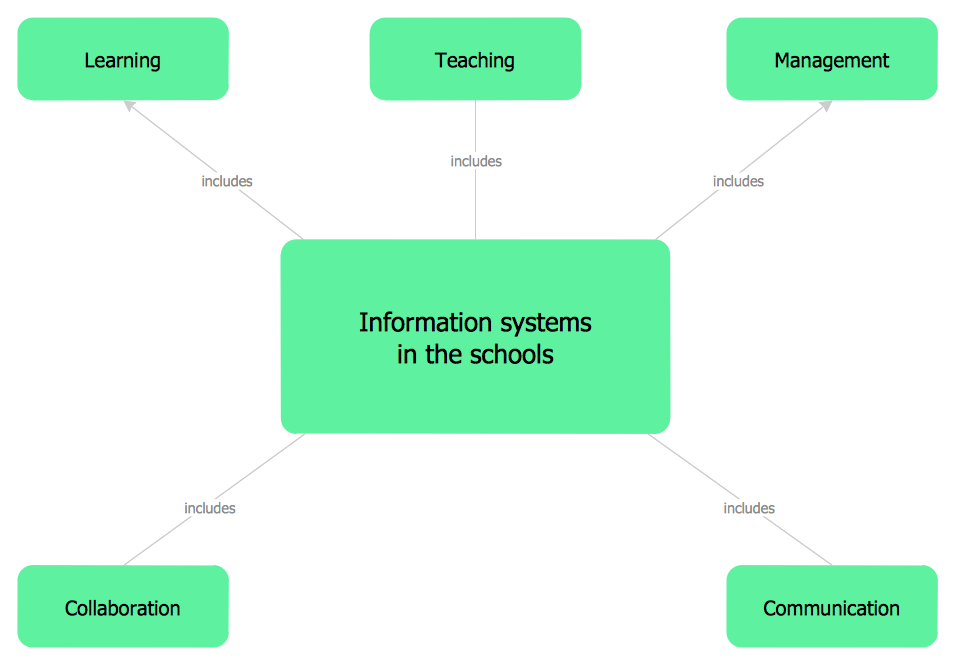
What is a Concept Map and what software is effective for its design? A concept map or conceptual diagram is a diagram that depicts suggested relationships between concepts. As for effective software - we suggest you to pay attention for the ConceptDraw PRO diagramming and vector drawing software. Extended with Concept Maps Solution from the "Diagrams" Area it is a real godsend for you.Concept Mapping
Being usually a very complex process that requires a lot of skills, patience, time, and artistic abilities, the concept mapping process now is incredibly easy thanks to the Concept Maps Solution from the "Diagrams" Area of ConceptDraw Solution Park.Flow Chart Online
Flow Chart is a great visualization tool for the flow of a process, algorithm or procedure with a lot of benefits. It is convenient to use a powerful software for creating flow charts. Now we have the best flow chart maker online design software - ConceptDraw PRO enhanced with Flowcharts Solution from the "Diagrams" Area of ConceptDraw Solution Park.Cross-Functional Flowchart
Cross-Functional Flowchart - to draw cross functional process maps is by starting with a cross-functional flowchart samples and templates. Easy to draw sample cross functional Process Flow Diagrams. Using a Cross-Functional flowchart is a clear way of showing each team member’s responsibilities and how processes get shared or transferred between different teams and departments.Use cross-functional flowcharts to show the relationship between a business process and the functional units (such as departments) responsible for that process. To create it use the best flowchart maker of ConceptDraw PRO.

Process Flowchart
ConceptDraw is Professional business process mapping software for making process flow diagram, workflow diagram, general flowcharts and technical illustrations for business documents. It is includes rich examples, templates, process flowchart symbols. ConceptDraw flowchart maker allows you to easier create a process flowchart. Use a variety of drawing tools, smart connectors, flowchart symbols and shape libraries to create flowcharts of complex processes, process flow diagrams, procedures and information exchange.
Simple Diagramming
Create flowcharts, org charts, floor plans, business diagrams and more with ConceptDraw PRO.
Influence Diagram Software
Influence diagram (ID) is a graphical and mathematical representation of the decision. Influence diagrams are widely used in the decision analysis and in the game theory. They are the alternative to the decision tree. The influence diagram gives to analyst the high-level conceptual view that it can use to build the detailed quantitative model.This sample shows the Influence diagram. It is a directed acyclic graph with three types of nodes: Decision node is drawn as a rectangle, Uncertainty node is drawn as an oval, Value node is drawn as an octagon. The nodes are connected with arcs.
Accounting Data Flow from the Accounting Flowcharts Solution
Accounting Data Flow from the Accounting Flowcharts Solution visually describes the financial accounting process, shows the accumulated information about transactions and events for creating the balance sheet and the final income statement.Accounting Flowcharts Solution contains also a wide variety of templates and samples that you can use as the base for your own Accounting Flowcharts of any complexity.
ConceptDraw Arrows10 Technology
How should diagramming software work? Is it possible to develop a diagram as quickly as the ideas come to you? The innovative ConceptDraw Smart Connectors Technology - This is more than enough versatility to draw any type of diagram with any degree of complexity.Connection points are necessary for diagramming network, flowchart and organizational charts. In ConceptDraw you connect shapes by attaching, or snapping and gluing, connectors to shape connection points.
SIPOC Diagram
SIPOC is a tool that summarizes the inputs and outputs of one or more processes in table form.You need to draw professional looking SIPOC Diagram quick and easy? Pay please your attention on ConceptDraw PRO diagramming and vector drawing software. Extended with Business Process Mapping Solution from the Business Processes Area of ConceptDraw Solution Park, it suits ideal for this.
Spider Chart Template
This sample shows the Spider Chart that represents the budget and spending for one organization and allows to compare them. The multivariate data are represented on the Spider Chart as a two-dimensional chart with four or more variables displayed on the axes that start in one point. The Spider Charts are used in the management, business and sport.How to Create Flowcharts for an Accounting Information System
Accounting information is a system of processes to represent financial and accounting data that is used by decision makers. To represent accounting processes there are special symbols which are used to create accounting flowcharts.Flowcharts help users of Accounting Information System to understand the step sequences of accounting processes. Use ConceptDraw PRO with Accounting Flowcharts solution to document and communicate visually how accounting processes work, and how each operation is done.
- Concept Map Maker
- Bubble Map Maker | Concept Map Maker | Mind Map Making ...
- Concept Map Maker | How To Make a Concept Map | Bubble Map ...
- Concept Mapping | Concept Map Maker | What Is a Concept Map ...
- How To Make a Concept Map | Concept Map | Concept Map Maker ...
- Concept Map Maker | Mind Map Making Software | Quality ...
- How To Make a Concept Map
- How to Convert a Mind Map into MS Word Document | Concept Map ...
- Venn Diagram Concept Map
- Concept Map Venn Diagram
- Concept Maps | What Is a Concept Map | Concept Mapping | What Is ...
- How to Add a Concept Map to a PowerPoint Presentation Using ...
- Online shop - Concept map | Concept Map | Simple Diagramming ...
- Concept Map Of Production
- Concept Map Examples
- Concept Map Of Management
- Concept map - Template | How To Make a Concept Map | Concept ...
- Risk management - Concept map | How To Make a Concept Map ...
- Online shop - Concept map | How to Make a Web Page from Your ...
- How To Make a Concept Map | The Best Flowchart Software ...
- ERD | Entity Relationship Diagrams, ERD Software for Mac and Win
- Flowchart | Basic Flowchart Symbols and Meaning
- Flowchart | Flowchart Design - Symbols, Shapes, Stencils and Icons
- Flowchart | Flow Chart Symbols
- Electrical | Electrical Drawing - Wiring and Circuits Schematics
- Flowchart | Common Flowchart Symbols
- Flowchart | Common Flowchart Symbols


