The Best Flowchart Software Available

ConceptDraw PRO vector diagramming and business graphics software enhanced with with templates, green and interactive flowchart makers, samples and stencil libraries from ConceptDraw Solution Park which all focused to help with drawing flowcharts, block diagrams, bar charts, histograms, pie charts, divided bar diagrams, line graphs, area charts, scatter plots, circular arrows diagrams, Venn diagrams, bubble diagrams, concept maps, and others.

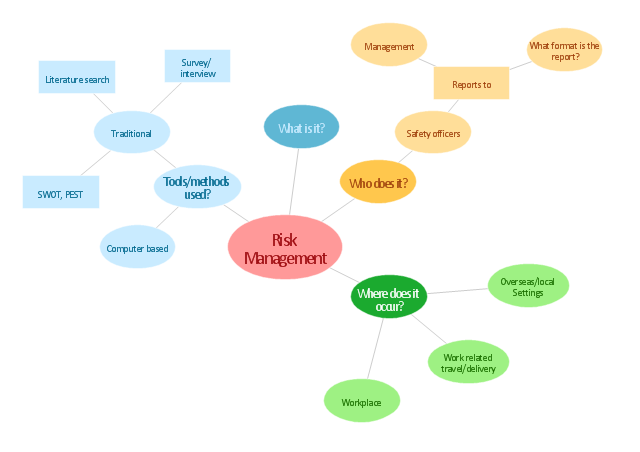
"Risk management is the identification, assessment, and prioritization of risks (defined in ISO 31000 as the effect of uncertainty on objectives, whether positive or negative) followed by coordinated and economical application of resources to minimize, monitor, and control the probability and/ or impact of unfortunate events or to maximize the realization of opportunities. Risks can come from uncertainty in financial markets, threats from project failures (at any phase in design, development, production, or sustainment life-cycles), legal liabilities, credit risk, accidents, natural causes and disasters as well as deliberate attack from an adversary, or events of uncertain or unpredictable root-cause. ... Methods, definitions and goals vary widely according to whether the risk management method is in the context of project management, security, engineering, industrial processes, financial portfolios, actuarial assessments, or public health and safety.
The strategies to manage threats (uncertainties with negative consequences) typically include transferring the threat to another party, avoiding the threat, reducing the negative effect or probability of the threat, or even accepting some or all of the potential or actual consequences of a particular threat, and the opposites for opportunities (uncertain future states with benefits)." [Risk management. Wikipedia]
The concept map example "Risk management" was created using the ConceptDraw PRO diagramming and vector drawing software extended with the Concept Maps solution from the area "What is a Diagram" of ConceptDraw Solution Park.
Concept map
How To Make a Concept Map

 Concept Maps
The technique of concept mapping was developed as a constructive way of representing knowledge in science and increasing the meaningfulness of learning. Now, the creation of a concept map is extremely helpful when used in education as learning and teaching techniques that assist memorization. Concept maps are also used for idea generation in brainstorming sessions, and for detailing the structure of complex ideas.
Concept Map Maker


PDPC

Simple Diagramming

Bubble diagrams with ConceptDraw PRO

Rainfall Bar Chart

This sample was created in ConceptDraw PRO diagramming and vector drawing software using the Bar Graphs Solution from the Graphs and Charts area of ConceptDraw Solution Park.
Onion Diagram Maker

ConceptDraw PRO diagramming and vector drawing software extended with Stakeholder Onion Diagrams Solution from the Management Area of ConceptDraw Solution Park is a professional Onion Diagram Maker.
Easy Flowchart Program and Standard Flowchart Symbols


Best Program to Create a Fowchart

Professional Diagram and Flowchart Software

- Risk management - Concept map
- Risk management - Concept map
- Risk management - Concept map | The Best Flowchart Software ...
- Risk management - Concept map
- Concept Map Risk Management
- Risk management - Concept map | The Best Flowchart Software ...
- Risk management - Concept map | Concept Map In Liabilities
- Team psychological characteristics - Concept map | Safety and ...
- Risk management - Concept map | Mind Map Making Software ...
- Concept Map Of Production
- Risk management - Concept map | How To Make a Concept Map ...
- Project Management Concept Map
- Team psychological characteristics - Concept map | Risk ...
- Risk Management Assessment
- Disaster Risk Management Mind Map
- Mind Map About Disaster Risk Management
- Block Diagram Of Risk Management
- Production Concept Map
- Mind Map About Disaster Risk Reduction
- Risk Management Tools Examples
- ERD | Entity Relationship Diagrams, ERD Software for Mac and Win
- Flowchart | Basic Flowchart Symbols and Meaning
- Flowchart | Flowchart Design - Symbols, Shapes, Stencils and Icons
- Flowchart | Flow Chart Symbols
- Electrical | Electrical Drawing - Wiring and Circuits Schematics
- Flowchart | Common Flowchart Symbols
- Flowchart | Common Flowchart Symbols