 Value Stream Mapping
Value stream mapping solution extends ConceptDraw PRO software with templates, samples and vector stencils for drawing the Value Stream Maps (VSM) in lean manufacturing practice.
Process Flowchart


Business Tools Perceptual Mapping

Perception Mapping helps organizations measure and transform all aspects of their business, people and culture. Perception Mapping allows to represent the complex relationships graphically, helps identify potential problems of the organization and make the best decisions.
Flow chart Example. Warehouse Flowchart

Standard warehousing process flow diagram and standard workflow diagram used for process identification for further evaluating effectiveness and profitability of overall business process. Use the ConceptDraw PRO diagramming and vector drawing software extended with the Flowcharts solution from the Diagrams area of ConceptDraw Solution Park to design your own workflow diagrams, process flow diagram and flow charts. Need to use Process Flow Diagram for designing Warehouse packages flow.

 Fishbone Diagram
Fishbone Diagrams solution extends ConceptDraw PRO software with templates, samples and library of vector stencils for drawing the Ishikawa diagrams for cause and effect analysis.
Bar Diagrams for Problem Solving. Create manufacturing and economics bar charts with Bar Graphs Solution

Create Flowchart

Flowcharts solution from the Diagrams area of ConceptDraw Solution Park helps you to design the professional looking Flowchart Diagrams quick and easy using the ConceptDraw PRO diagramming and vector drawing software.
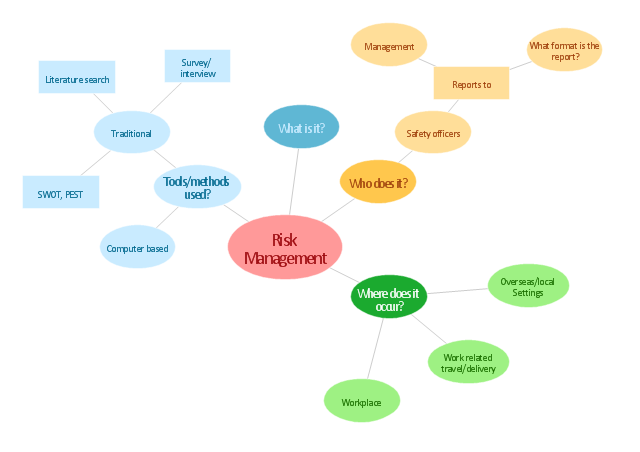
"Risk management is the identification, assessment, and prioritization of risks (defined in ISO 31000 as the effect of uncertainty on objectives, whether positive or negative) followed by coordinated and economical application of resources to minimize, monitor, and control the probability and/ or impact of unfortunate events or to maximize the realization of opportunities. Risks can come from uncertainty in financial markets, threats from project failures (at any phase in design, development, production, or sustainment life-cycles), legal liabilities, credit risk, accidents, natural causes and disasters as well as deliberate attack from an adversary, or events of uncertain or unpredictable root-cause. ... Methods, definitions and goals vary widely according to whether the risk management method is in the context of project management, security, engineering, industrial processes, financial portfolios, actuarial assessments, or public health and safety.
The strategies to manage threats (uncertainties with negative consequences) typically include transferring the threat to another party, avoiding the threat, reducing the negative effect or probability of the threat, or even accepting some or all of the potential or actual consequences of a particular threat, and the opposites for opportunities (uncertain future states with benefits)." [Risk management. Wikipedia]
The concept map example "Risk management" was created using the ConceptDraw PRO diagramming and vector drawing software extended with the Concept Maps solution from the area "What is a Diagram" of ConceptDraw Solution Park.
Concept map
Basic Flowchart Symbols and Meaning


 ConceptDraw Solution Park
ConceptDraw Solution Park collects graphic extensions, examples and learning materials
"Value Stream Mapping (VSM):
– Special type of flow chart that uses symbols known as "the language of Lean" to depict and improve the flow of inventory information. ...
Value Stream Mapping ...
Provide optimum value to the customer through a complete value creation process with minimum waste in:
– Design (concept to customer);
– Design (concept to customer);
– Build (order to delivery);
– Sustain (in-use through life cycle to service)." [courses.washington.edu/ ie337/ Value_ Stream_ Mapping.pdf]
This sample Value Stream Map shows how customer value is created in the steps of manufacturing, production control, and shipping processes.
This VSM example was created using the ConceptDraw PRO diagramming and vector drawing software extended with the Value Stream Mapping solution from the Quality area of ConceptDraw Solution Park.
Value stream mapping

Basic Diagramming


Business Process Flowchart

The flowcharts are divided into rows/columns of functional units. Blocks of various shapes represent the process steps, and are placed in rows/columns of the responsible functional units.
Material Requisition Flowchart. Flowchart Examples

The flowchart example shows the material requisition business process.
Business Processes description with ConceptDraw PRO

- Production Concept Map
- Concept Map Of Production
- Concept Map Example Production
- Team psychological characteristics - Concept map | Safety and ...
- Map And Value Concepts Examples
- Flow chart Example . Warehouse Flowchart | Online shop - Concept ...
- Concept Diagram Example From Manufacturing
- Concept Map Of Cyber Production
- Production Concept Diagram
- Concept Maps | Process Flowchart | ConceptDraw MINDMAP ...
- Biology Concept Map Examples
- Risk management - Concept map | How To Make a Concept Map ...
- Risk management - Concept map | Concept Map In Liabilities
- Business Processes | Concept Maps | Www Draw A Flowchart To ...
- Concept Mapping Software
- Data Flow Diagram Model | Process Flowchart | Manufacturing 8 Ms ...
- Detailed Example Of Value Stream Concept
- What Is a Concept Map | Collaboration in a Project Team | Sagested ...
- Bubble Map Maker | Concept Maps | Process Flowchart | Simple ...
- Value Stream Mapping | Value stream map example | Value Stream ...
- ERD | Entity Relationship Diagrams, ERD Software for Mac and Win
- Flowchart | Basic Flowchart Symbols and Meaning
- Flowchart | Flowchart Design - Symbols, Shapes, Stencils and Icons
- Flowchart | Flow Chart Symbols
- Electrical | Electrical Drawing - Wiring and Circuits Schematics
- Flowchart | Common Flowchart Symbols
- Flowchart | Common Flowchart Symbols