Account Flowchart Stockbridge System. Flowchart Examples

This is a flowchart of a data processing system combining manual and computerized processing to handle accounts receivable, billing, and general ledger.
How to Make an Accounting Process Flowchart

Accounting Data Flow from the Accounting Flowcharts Solution

Accounting Flowcharts Solution contains also a wide variety of templates and samples that you can use as the base for your own Accounting Flowcharts of any complexity.
 Cross-Functional Flowcharts
Cross-functional flowcharts are powerful and useful tool for visualizing and analyzing complex business processes which requires involvement of multiple people, teams or even departments. They let clearly represent a sequence of the process steps, the order of operations, relationships between processes and responsible functional units (such as departments or positions).
Model Based Systems Engineering

Accounting Flowchart Symbols

Flowchart design. Flowchart symbols, shapes, stencils and icons

Mavericks have always desired to stand apart and gorgeous design is the recipe for that. Any business graphic document will be more understandable if will use an expository color scheme for their parts. Flowchart design makes versatile presenting and explaining of the process and gives a fresh view that distinguishes it from black and white flowcharts on a paper. Workflow diagram or process flow diagrams become more understandable to ordinary people when it use minimum symbols and special signs.
The best design can be accomplished by starting from any of the suitable Conceptdraw examples. Pick one of them and begin to input proper text into each Flowchart symbols and shapes. Apply less colors in the document and don't turn into rainbow your diagram, three or four will be enough, also note that business process flowchart may not contain bright color hues. The next clue is to use identical colors for same flowchart shape types.

Work Flow Chart

Accounts Payable Process Flow Chart
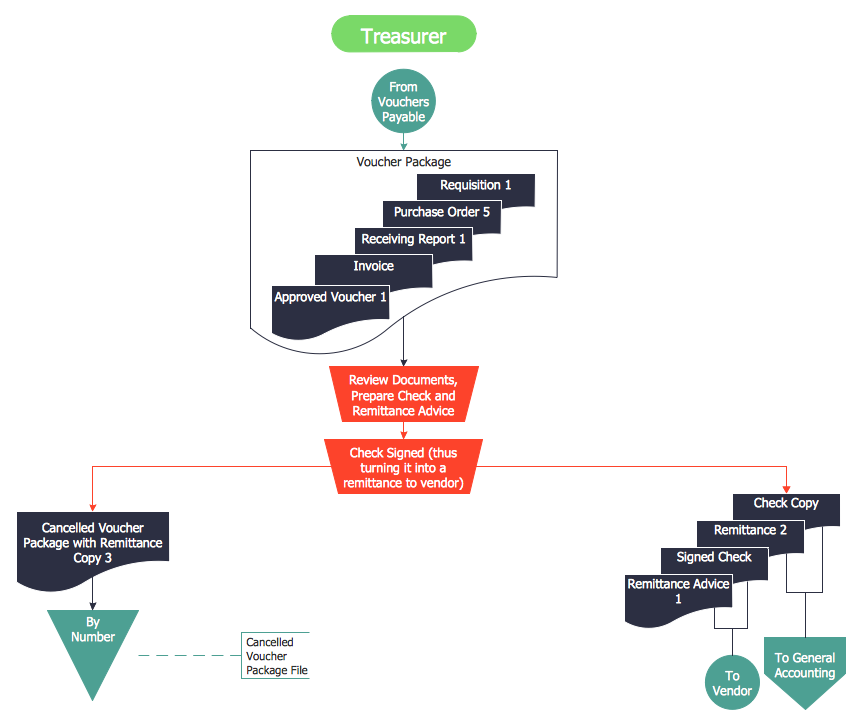
The Accounts Payable Process Flow Chart is very popular and widely used type of accounting flowcharts. Now their designing is simple thanks to the Accounting Flowcharts Solution that provides the Accounting Flowcharts library of predesigned commonly-used shapes and a set of templates and samples.
- Data Flow Diagram Of Computerized Library System
- Audit Flowcharts | Library System Flowchart Sample
- DroidDia prime | Data Flow Diagram For A Manual Library
- DFD Library System | Data Flow Diagram Symbols. DFD Library ...
- Top 5 Android Flow Chart Apps | Manual System Flowchart
- Flowchart On A Computerized Accounting System
- Software development with ConceptDraw Products | Block Diagram ...
- Manual Library System Flow Chart
- Symbol In Computerized Accounting System Flowchart
- Simple Library System Flowchart
- ERD | Entity Relationship Diagrams, ERD Software for Mac and Win
- Flowchart | Basic Flowchart Symbols and Meaning
- Flowchart | Flowchart Design - Symbols, Shapes, Stencils and Icons
- Flowchart | Flow Chart Symbols
- Electrical | Electrical Drawing - Wiring and Circuits Schematics
- Flowchart | Common Flowchart Symbols
- Flowchart | Common Flowchart Symbols