Data Flow Diagram Software
When studying a business process or system that involves the transfer of data, it is common to use a data flow diagram (DFD) to visualize how that data is processed. While initially used exclusively in regards to the flow of data through a computer system, DFDs are now employed as a business modelling tool, describing business events and interactions, or physical systems involving data storage and transfer.ConceptDraw PRO is a powerful Data Flow Diagram Software thanks to the Data Flow Diagrams solution from the Software Development area of ConceptDraw Solution Park.
You can use the predesigned DFD vector objects that are grouped in 3 libraries of Data Flow Diagrams solution: Data Flow Diagrams Library; Gane-Sarson Notation Library; Yourdon and Coad Notation Library.
ConceptDraw PRO DFD Software
Our DFD software ConceptDraw PRO allows you to quickly create DFD with data storages, external entities, functional transforms, data flows, as well as control transforms and signals. DFD program ConceptDraw PRO has hundreds of templates, and a wide range of libraries with all nesassary ready-made drag-and-drop.UML Use Case Diagram Example Social Networking Sites Project
UML Diagrams Social Networking Sites Project. This sample was created in ConceptDraw PRO diagramming and vector drawing software using the UML Use Case Diagram library of the Rapid UML Solution from the Software Development area of ConceptDraw Solution Park.This sample shows the Facebook Socio-health system and is used at the projection and creating of the social networking sites.
Structured Systems Analysis and Design Method (SSADM) with ConceptDraw PRO
Structured Systems Analysis and Design Method SSADM is the method which is used at projecting and analysis of information systems. SSADM is based on the data flow diagrams. At the description of data flows out of the system and into the system DFD, which denote boundaries of the system, are used.Types of Flowcharts
A Flowchart is a graphically representation of the process, algorithm or the step-by-step solution of the problem. There are ten types of Flowcharts. Using the Flowcharts solution from the Diagrams area of ConceptDraw Solution Park you can easy and quickly design the Flowchart of any of these types.
Context Diagram Template
This template shows the Context Diagram. It was created in ConceptDraw PRO diagramming and vector drawing software using the Block Diagrams Solution from the “Diagrams” area of ConceptDraw Solution Park.
The context diagram graphically identifies the system. external factors, and relations between them. It’s a high level view of the system. The context diagrams are widely used in software engineering and systems engineering for designing the systems that process the information.
Android UI Design Tool
The app's user interface is everything what user see and interact with on its electronic device. Great number of touch screen smartphones and tablets now work under the Linux-based Android operating system.Android UI design is a daunting process which requires certain knowledge, abilities and skills from Android developers and designers. Now it is available the special Android UI design tool - ConceptDraw PRO diagramming and vector drawing software supplied with Android User Interface Solution from the Software Development Area of ConceptDraw Solution Park.
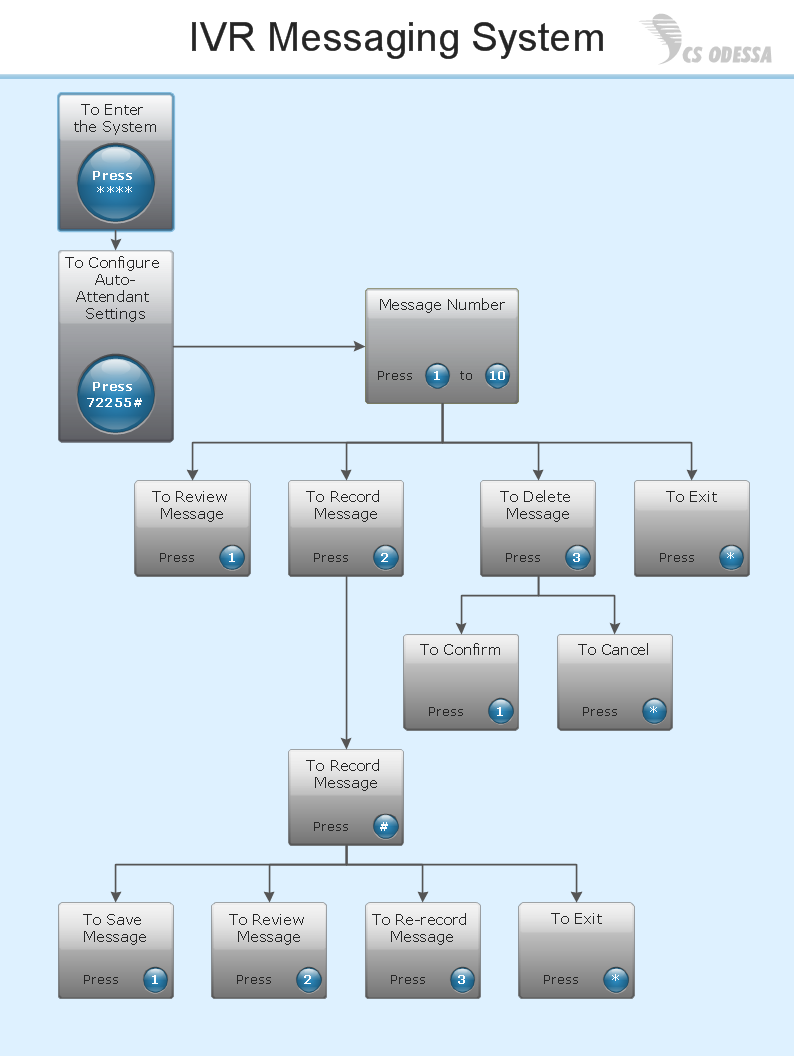
Interactive Voice Response Network Diagram
ConceptDraw solution Computer and Networks provides Interactive Voice Response samples, templates and library of 35 vector stencils for drawing the IVR network diagrams.Use ConceptDraw PRO diagramming and vector drawing software enhanced with solution Computer and Networks to visualize the logical and physical structure of IVR systems for inbound and outbound call centers and voice mail systems.

Flowchart
With ConceptDraw PRO it is easy to create professional flowchart diagrams of any complexity. With the use of numerous templates and the extensive libraries of ready-made symbols and blocks; depicting your business processes has never been easier.Local area network (LAN). Computer and Network Examples
A local area network (LAN) is a devices network that connect with each other in the scope of a home, school, laboratory, or office. Usually, a LAN comprise computers and peripheral devices linked to a local domain server. All network appliances can use a shared printers or disk storage. A local area network serve for many hundreds of users. Typically, LAN includes many wires and cables that demand a previously designed network diagram. They are used by IT professionals to visually document the LANs physical structure and arrangement.ConceptDraw - Perfect Network Diagramming Software with examples of LAN Diagrams. ConceptDraw Network Diagram is ideal for network engineers and network designers who need to draw Local Area Network diagrams.

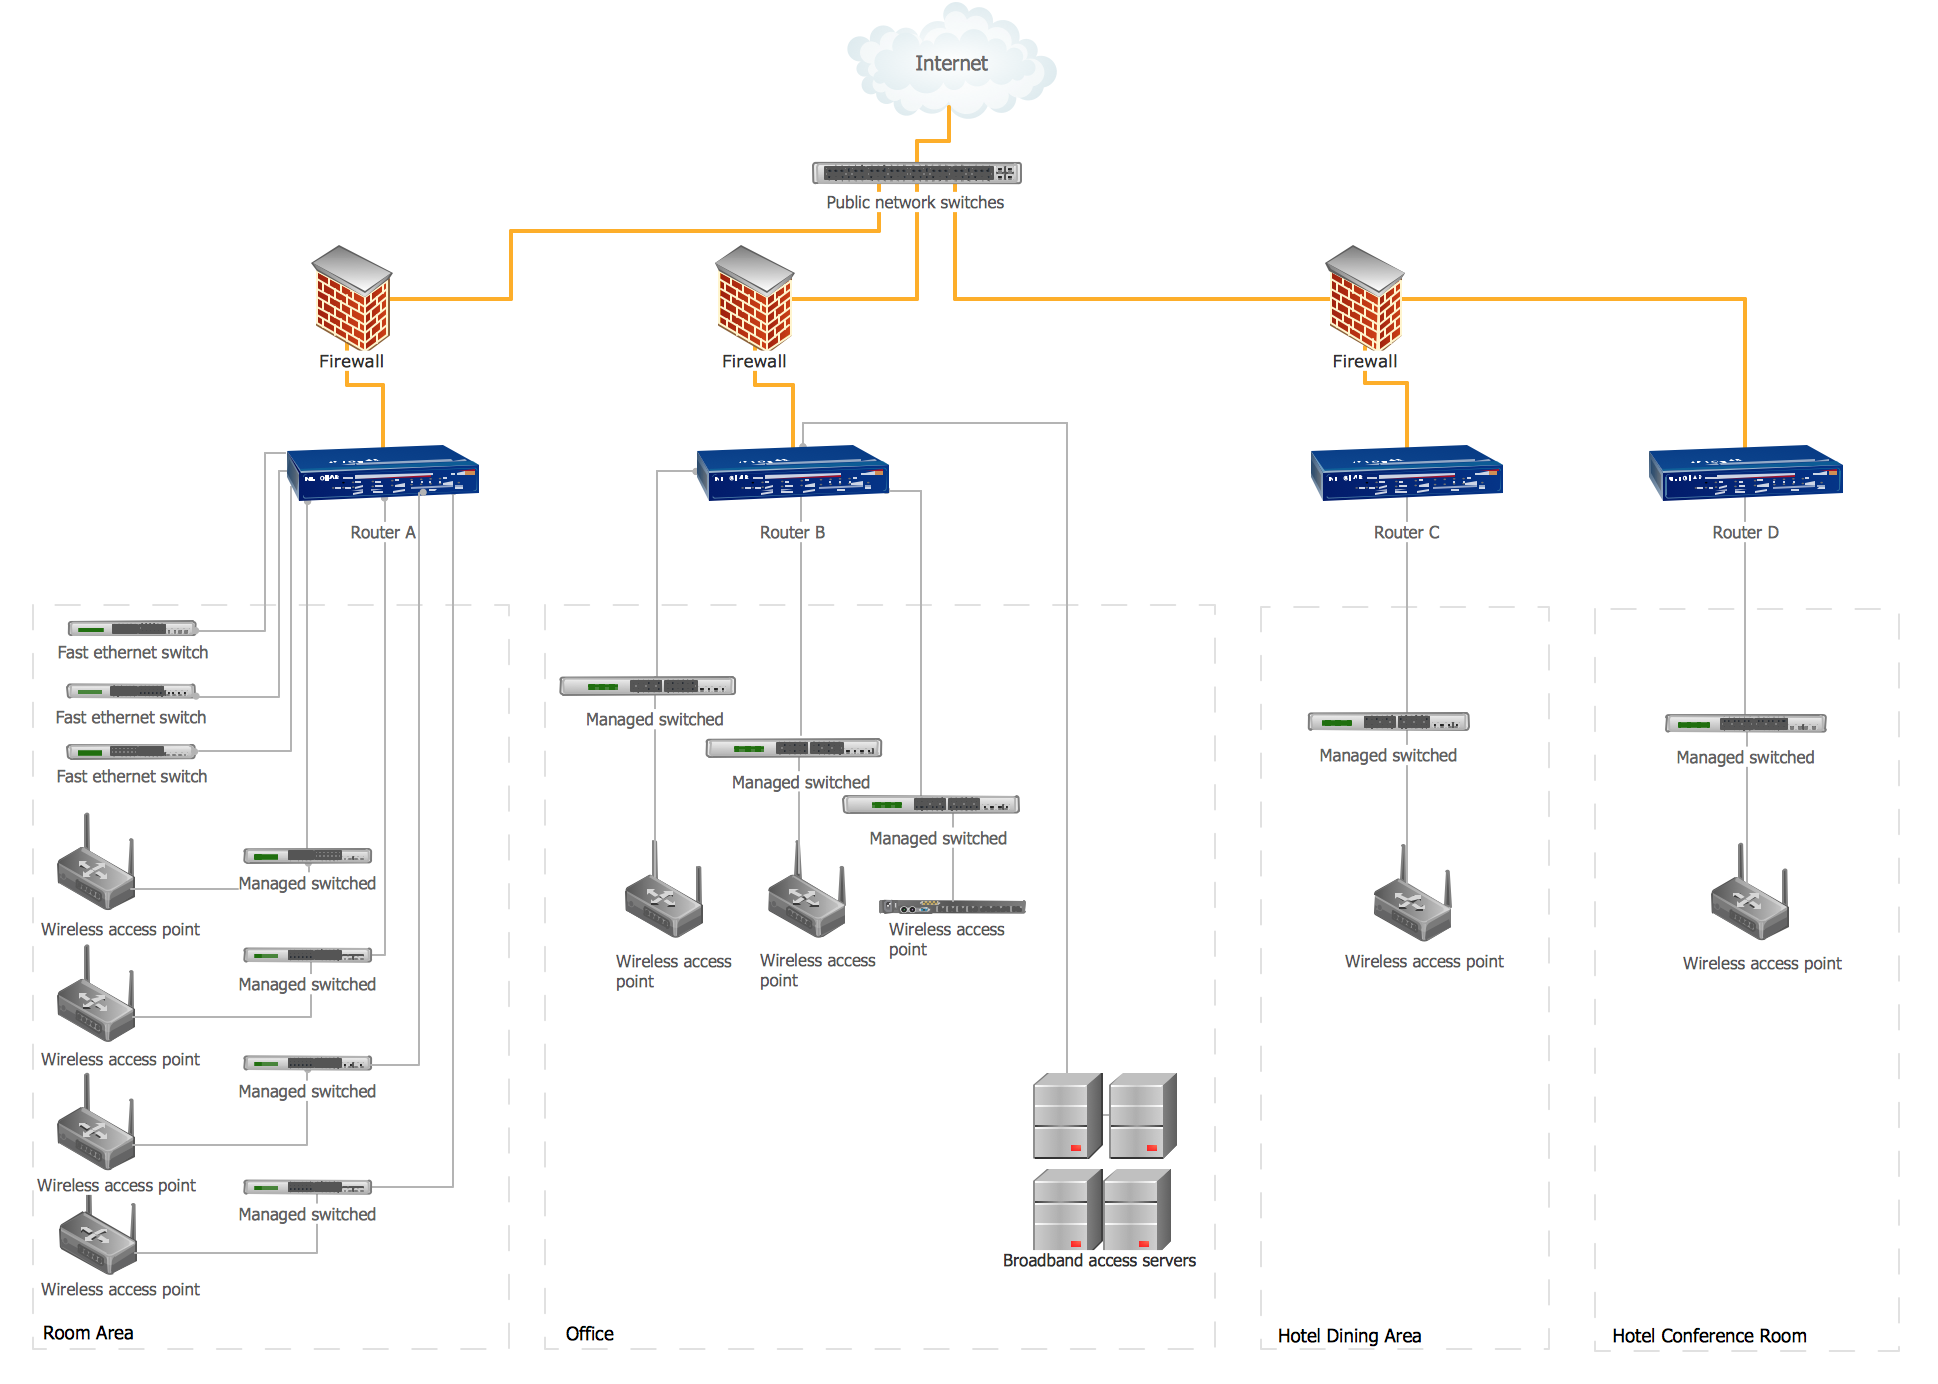
Hotel Network Topology Diagram
Hotel Network Topology Diagram - The Computer and Networks solution from Computer and Networks area of ConceptDraw Solution Park provides examples, templates and vector stencils library with symbols of local area network (LAN) and wireless LAN (WLAN) equipment.Use it to draw the physical and logical network topology diagrams for wired and wireless computer communication networks.

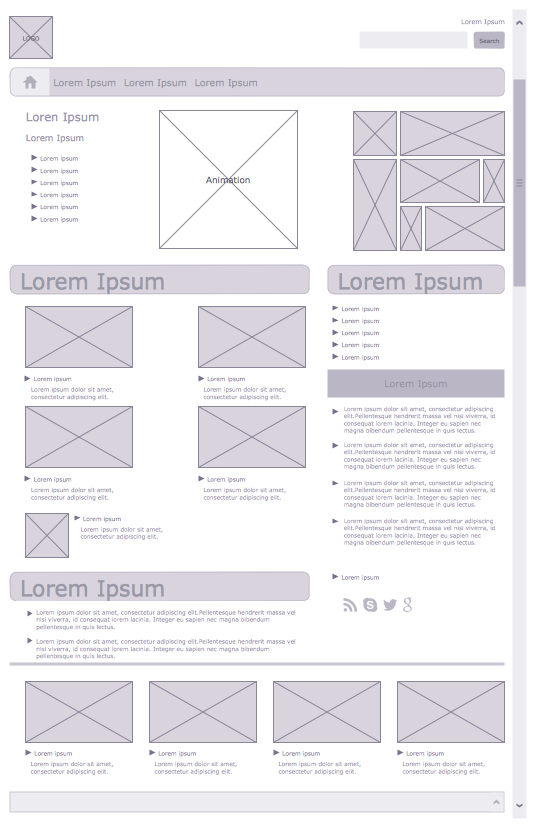
Wireframe Examples
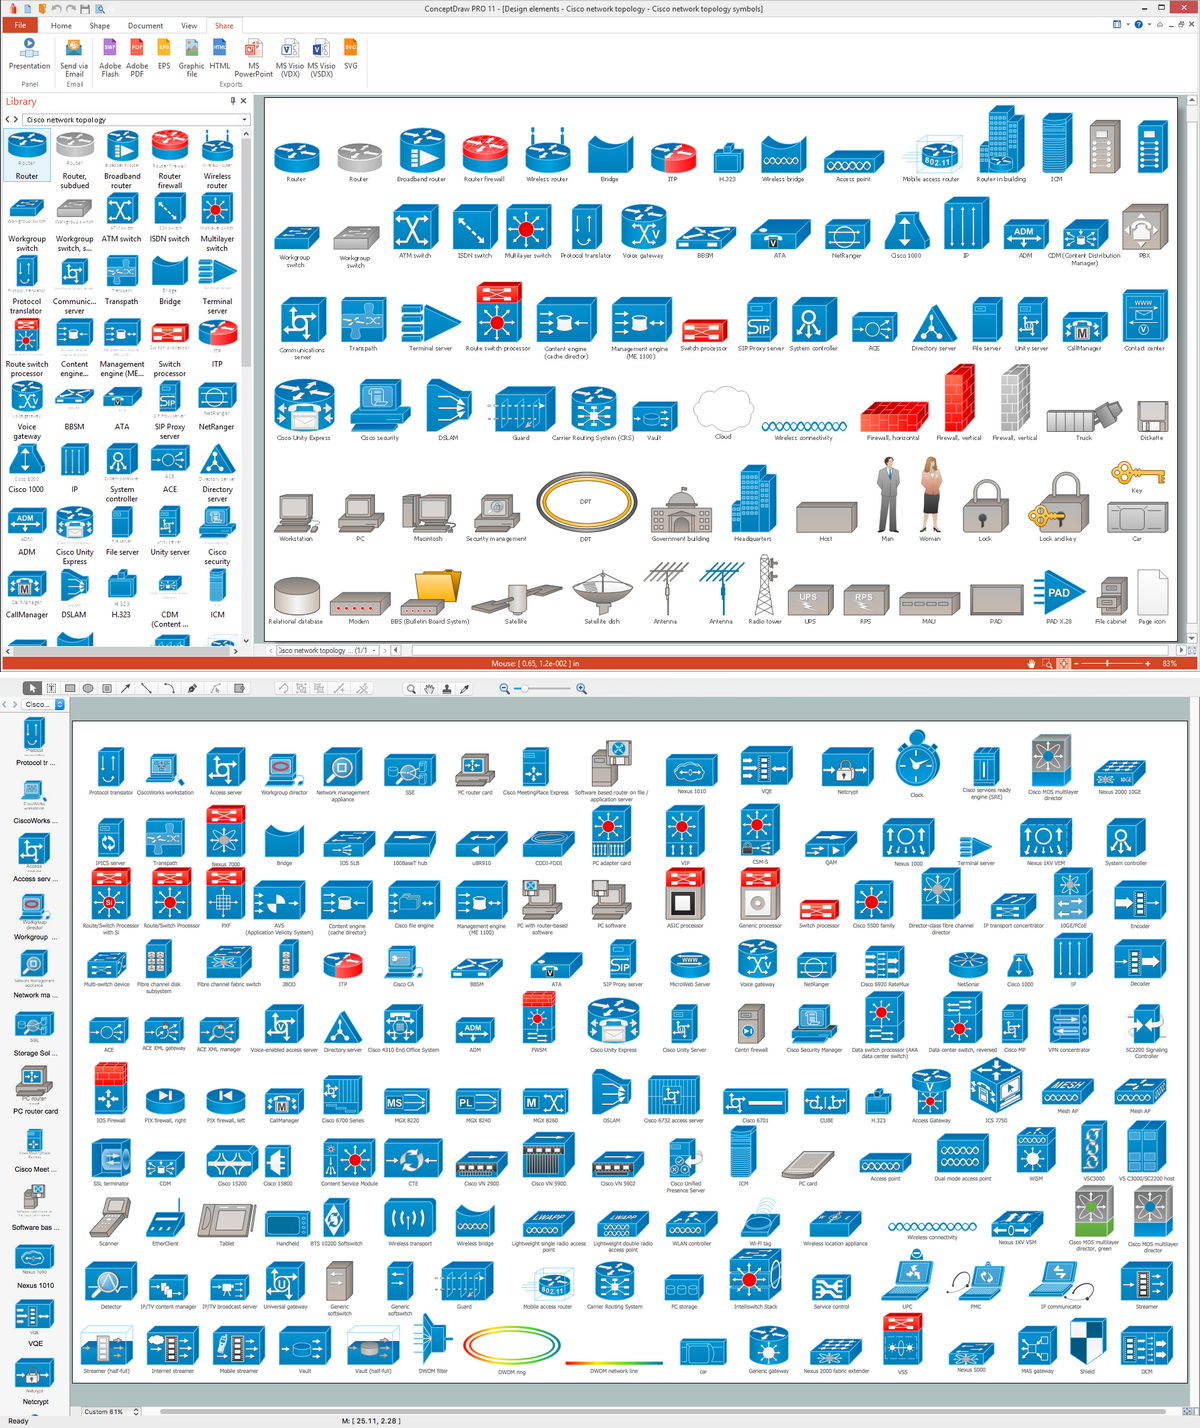
ConceptDraw PRO is a powerful diagramming and vector drawing software. Extended with Website Wireframe solution from the Software Development area, ConceptDraw PRO became the ideal software for prototype and design professional looking websites wireframes. Website Wireframe solution offers at your disposal wide variety of wireframe examples and samples which confirm this.Cisco Network Topology. Cisco icons, shapes, stencils and symbols
The Cisco Network Diagrams solution uses Cisco network symbols and Cisco icons to visualize computer networks. Cisco Network Topology is the arrangement of the Cisco symbols that display scheme of computer network.Any Cisco equipment on the network are named like node. Network diagram topology commonly designed within connected nodes. Cisco icons are worldwide acknowledged and mainly established as standard icons for network diagrams. You may use them loosely, but you may not rework them.
The Cisco Network Diagram shows how signals act on the networked devices, or how data routes on the network from one device to the other. There are number of physical network typologies that engineers use while constructing computer networks.
Pyramid Diagram
Pyramid diagrams help you visualize information as a triangle divided into horizontal slices. Labelled slices represent a hierarchy. Pyramids are used in marketing presentations to show and analyze hierarchy levels.3D triangular diagram of DIKW pyramid has 6 levels: measurement, facts, data, information, knowledge, wisdom.
The data component include different scattered signs or symbols which are merely useless until these random objective facts are somehow processed. Data is a resource which has to be manipulated or rearranged to get useful. Information can be extracted from a pile of data, it also can be mined from different data storages.
- Data flow Model Diagram
- Data Flow Diagram
- DFD Library System | Data Flow Diagrams | Data Flow Diagram ...
- How to Create a Data Flow Diagram using ConceptDraw PRO | Data ...
- Data Flow Diagrams | Data Flow Diagram | Data Flow Diagrams ...
- Data Flow Diagram For Store Management System
- Data Flow Diagrams | Data Flow Diagram (DFD) | Data Flow ...
- Network Topologies | Draw Dataflow Diagram For Tv Signal System
- Data Flow Diagram Of Export System
- Visio Diagram Showing Data Flow
- Data Flow Diagrams | Context Diagram Template | Process ...
- DFD Library System | Data Flow Diagram Symbols. DFD Library ...
- Draw The Fiow Of Data And Signal In A Computer System
- Data Flow Diagram Ppt For Library Management System
- Data Flow Diagrams (DFD)
- Process Flowchart | Data Flow Diagrams | Basic Flowchart Symbols ...
- Data Flow Diagram With Easy Business Example
- Data Flow Diagrams | Visio
- DFD Library System | Data Flow Diagram Symbols. DFD Library ...
- Process Flowchart | Data Flow Diagrams (DFD) | Stakeholder ...
- ERD | Entity Relationship Diagrams, ERD Software for Mac and Win
- Flowchart | Basic Flowchart Symbols and Meaning
- Flowchart | Flowchart Design - Symbols, Shapes, Stencils and Icons
- Flowchart | Flow Chart Symbols
- Electrical | Electrical Drawing - Wiring and Circuits Schematics
- Flowchart | Common Flowchart Symbols
- Flowchart | Common Flowchart Symbols


