The Data flow diagram (DFD) example "Payment for goods using UPS code scanner" shows data flow in process of payment for goods in the shop using the MaxiCode scanner.
"MaxiCode is a public domain, machine-readable symbol system originally created and used by United Parcel Service. Suitable for tracking and managing the shipment of packages, it resembles a barcode, but uses dots arranged in a hexagonal grid instead of bars. MaxiCode has been standardised under ISO/ IEC 16023.
A MaxiCode symbol (internally called "Bird's Eye", "Target", "dense code", or "UPS code") appears as a 1 inch square, with a bullseye in the middle, surrounded by a pattern of hexagonal dots. It can store about 93 characters of information, and up to 8 MaxiCode symbols can be chained together to convey more data. The centered symmetrical bullseye is useful in automatic symbol location regardless of orientation, and it allows MaxiCode symbols to be scanned even on a package traveling rapidly." [MaxiCode. Wikipedia]
This example of data flow diagram (Gane & Sarson notation) was created using the ConceptDraw PRO diagramming and vector drawing software extended with the Data Flow Diagrams solution from the Software Development area of ConceptDraw Solution Park.
DFD
---payment-for-goods-using-ups-code-scanner.png--diagram-flowchart-example.png)
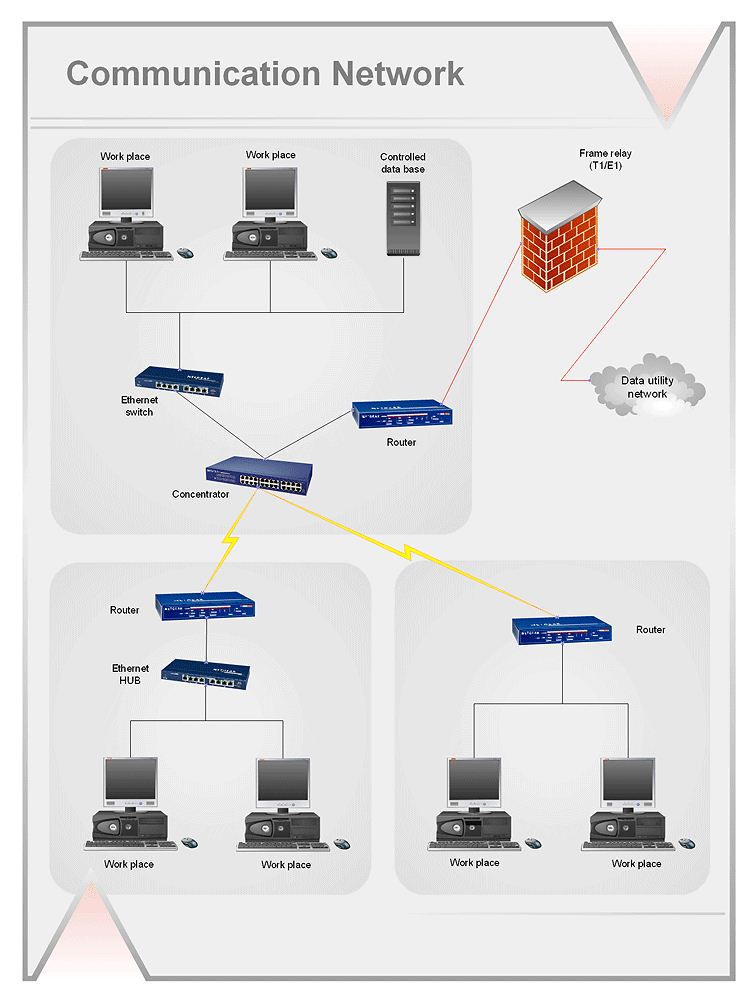
The vector stencils library "Computer network" contains 51 symbols of computer network devices and equipment for drawing computer network diagrams.
"Network Mapping Software.
A number of software tools exist to design computer network diagrams / or generate visual maps of networks, servers, storage, services, data centers, and other peripherals. Broadly, there are two types of software tools - those that help create diagrams manually and those that generate them using automated / semi-automated approaches.
Type of Software.
(1) Manual - allows users to design and draw logical and physical topology diagrams by manually placing icons and connections.
(2) Automated - generate topology diagrams / maps by traversing the network and automatically discovering resident devices or by importing network data." [Comparison of network diagram software. Wikipedia]
ConceptDraw PRO is the software for manual design of computer network diagrams. The solutions of the Computer and Networks area in ConceptDraw Solution Park extend ConceptDraw PRO with vector stencils libraries, templates and examples for creating the computer network diagrams.
The symbols example "Computer network - Vector stencils library" was created using the ConceptDraw PRO diagramming and vector drawing software extended with the Computer and Networks solution from the Computer and Networks area of ConceptDraw Solution Park.
www.conceptdraw.com/ solution-park/ computer-and-networks
Laptop

Desktop computer
Firewall

Bus

Ethernet
Star network

FDDI Ring

Token-ring

Comm-link

Modem
Laser printer
Inkjet printer
Image scanner
City

Ethernet hub
Wireless router
Network switch
iPod Classic

iPhone/ iPod Touch

Xserve RAID
XServe

Apple Thunderbolt Display

Data store

Mac Pro
iMac
RAID

Mainframe

Rack-mountable server
Server

PDA

Cloud

Computer monitor
Workstation
Router
IP Phone
Fax
Mobile phone
Smartphone
Compact Disk

Mouse

Apple Wireless Mouse

Computer keyboard
Apple Keyboard
Radio tower

Satellite dish

Satellite
Webcam
AirPort Extreme

Airport Express
MacBook

iPhone 4

Network Diagram Examples


Bubble diagrams in Landscape Design with ConceptDraw DIAGRAM

Network Diagramming with ConceptDraw DIAGRAM
- Data flow diagram (DFD) - Payment for goods using UPS code ...
- How To use Switches in Network Diagram | Computer network ...
- Network Glossary Definition | Computer network - Vector stencils ...
- Network Glossary Definition | Diagram Of Keyboard Mouse Scanner ...
- Star Network Topology | Network Topologies | Fully Connected ...
- Data flow diagram (DFD) - Payment for goods using UPS code ...
- Computer network - Vector stencils library | Logical Diagram Of ...
- Dfd Diagram For Barcode Scanner Application
- Er Diagram Of Barcode Scanner And Generator
- Network Printer | Physical LAN topology diagram | Mesh Network ...
- Simple Computer Scanner Drawing Image
- The Diagram Of Joystick And Scanner
- Diagram Of Mouse Joysticks Microphone Scanner
- Computer network - Vector stencils library | Technology - Vector ...
- Network Topology Scanner
- Network Printer | Office pictograms - Vector stencils library ...
- LAN topology diargam | Hotel Network Topology Diagram . Hotel ...
- Data Flow Diagram Symbols. DFD Library
- Ethernet local area network layout floor plan | Ethernet network ...
- Network Printer | Wireless access point - Network diagram | Wireless ...
- ERD | Entity Relationship Diagrams, ERD Software for Mac and Win
- Flowchart | Basic Flowchart Symbols and Meaning
- Flowchart | Flowchart Design - Symbols, Shapes, Stencils and Icons
- Flowchart | Flow Chart Symbols
- Electrical | Electrical Drawing - Wiring and Circuits Schematics
- Flowchart | Common Flowchart Symbols
- Flowchart | Common Flowchart Symbols