3D Network Diagrams. Computer and Network Examples

This example shows the 3D Network Diagram. It was created in ConceptDraw DIAGRAM using the 3D network elements from the Computer and Networks solution from the Computer and Networks area of ConceptDraw Solution Park.

Local area network (LAN). Computer and Network Examples
 diagram")
ConceptDraw - Perfect Network Diagramming Software with examples of LAN Diagrams. ConceptDraw Network Diagram is ideal for network engineers and network designers who need to draw Local Area Network diagrams.
Network Drawing Software

Create computer network designs, diagrams and schematics using ConceptDraw.
Network Icons

3D Network Diagram Software

Use more than 2 000 pre-designed 3D network elements for customizing your network diagrams. Computer & Networks solution allows you for design 3D LAN and WAN, schematic and wiring drawings.
Rack Diagrams

Examples of Flowcharts, Org Charts and More


Network Diagram Software. LAN Network Diagrams. Physical Office Network Diagrams

How to Create Flowcharts for an Accounting Information System

Flowcharts help users of Accounting Information System to understand the step sequences of accounting processes. Use ConceptDraw DIAGRAM with Accounting Flowcharts solution to document and communicate visually how accounting processes work, and how each operation is done.
Calculate the cost of creating or updating a wireless computer network

Drawing some wireless computer network as it may be a challenge, especially for those who do not have as much experience of doing it. That is why the CS Odessa team has developed the Wireless Networks solution so it can be used for simplifying all the ConceptDraw DIAGRAM users work on the needed diagrams.
Network Printer

 Block Diagrams
Block diagrams solution extends ConceptDraw DIAGRAM software with templates, samples and libraries of vector stencils for drawing the block diagrams.
 Computer Network Diagrams
Computer Network Diagrams solution extends ConceptDraw DIAGRAM software with samples, templates and libraries of vector icons and objects of computer network devices and network components to help you create professional-looking Computer Network Diagrams, to plan simple home networks and complex computer network configurations for large buildings, to represent their schemes in a comprehensible graphical view, to document computer networks configurations, to depict the interactions between network's components, the used protocols and topologies, to represent physical and logical network structures, to compare visually different topologies and to depict their combinations, to represent in details the network structure with help of schemes, to study and analyze the network configurations, to communicate effectively to engineers, stakeholders and end-users, to track network working and troubleshoot, if necessary.
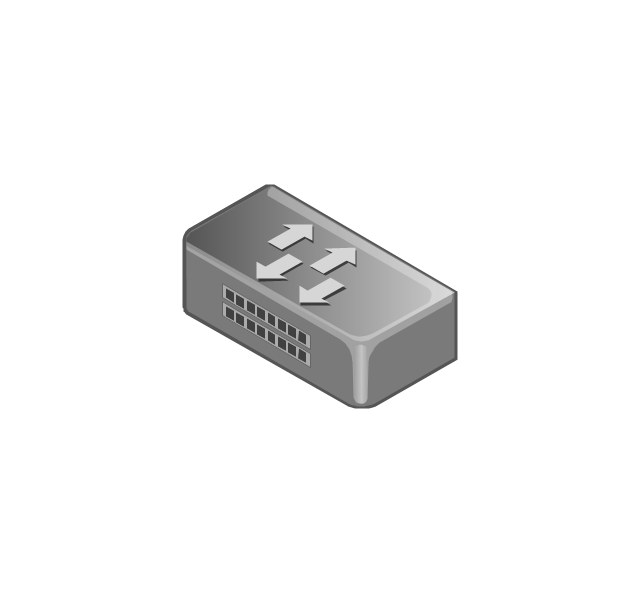
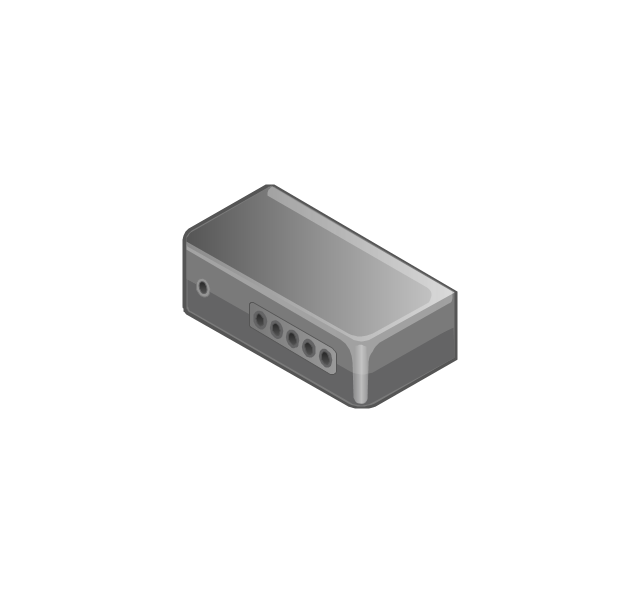
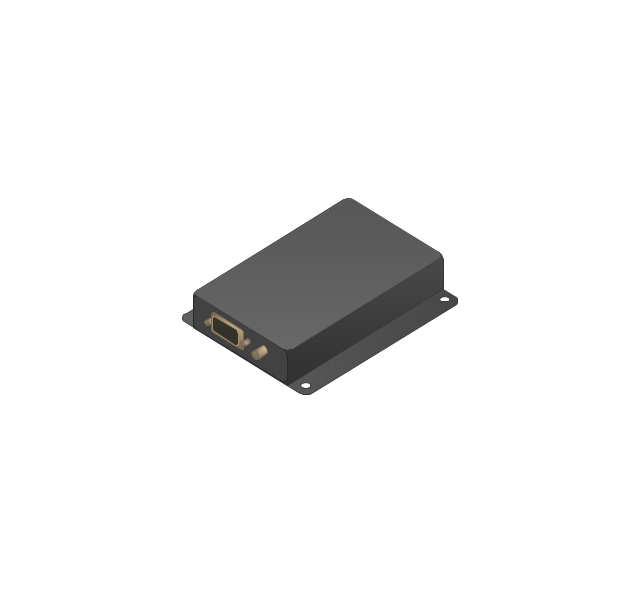
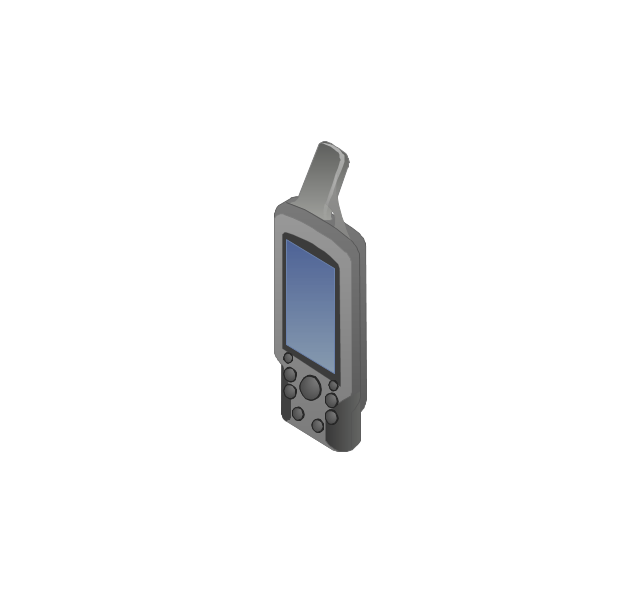
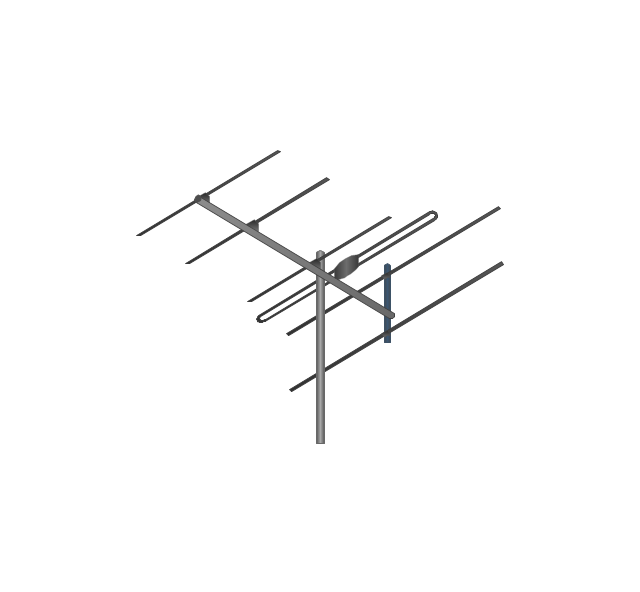
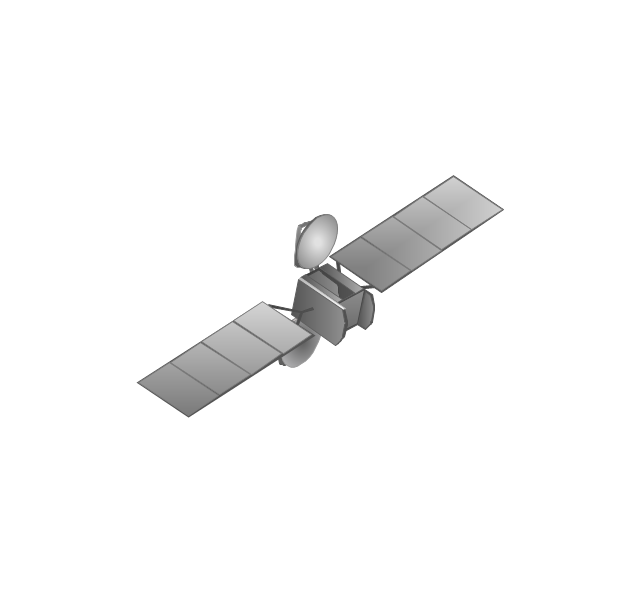
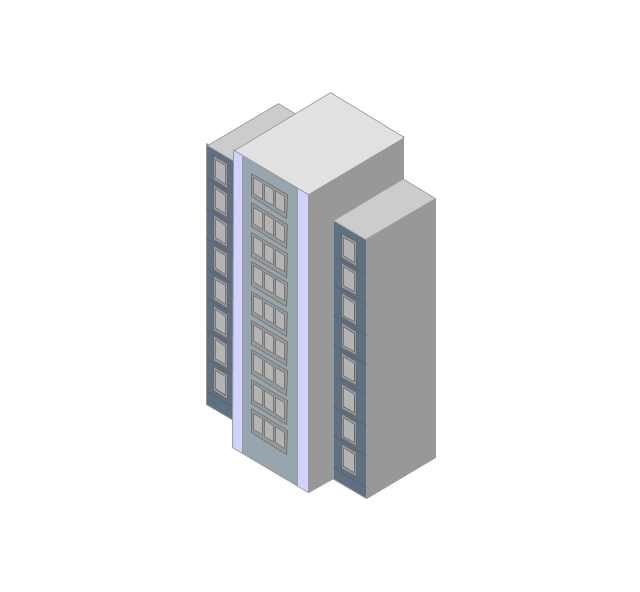
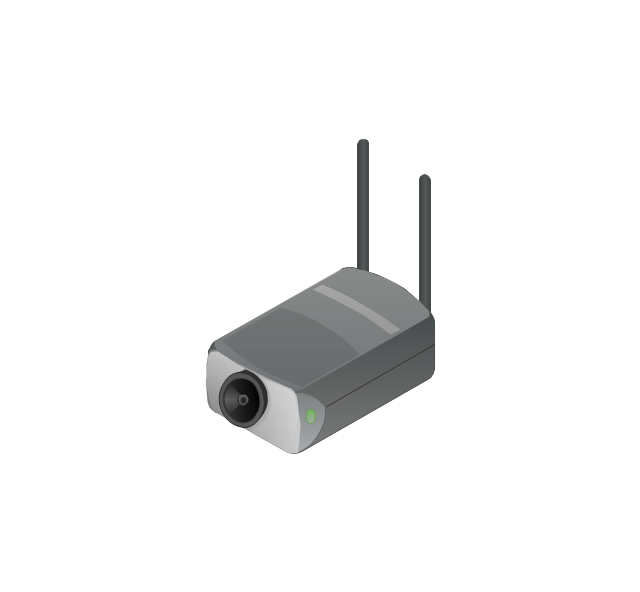
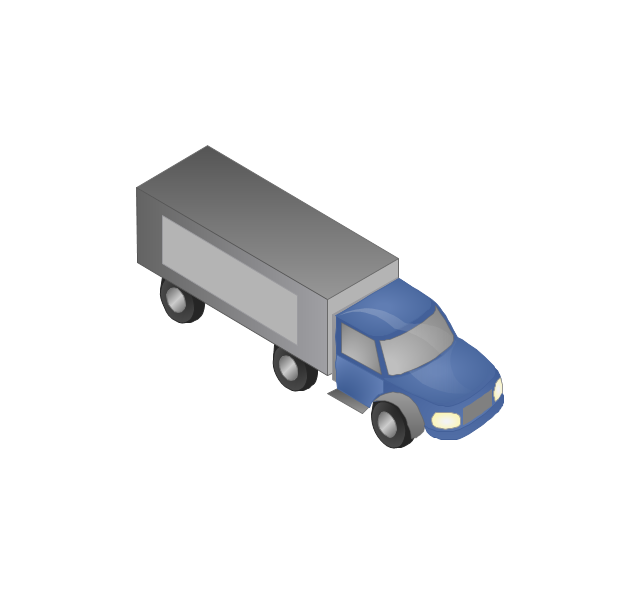
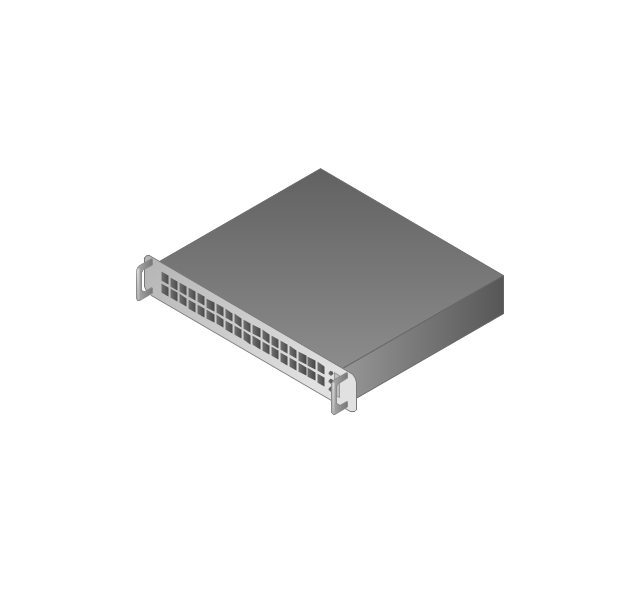
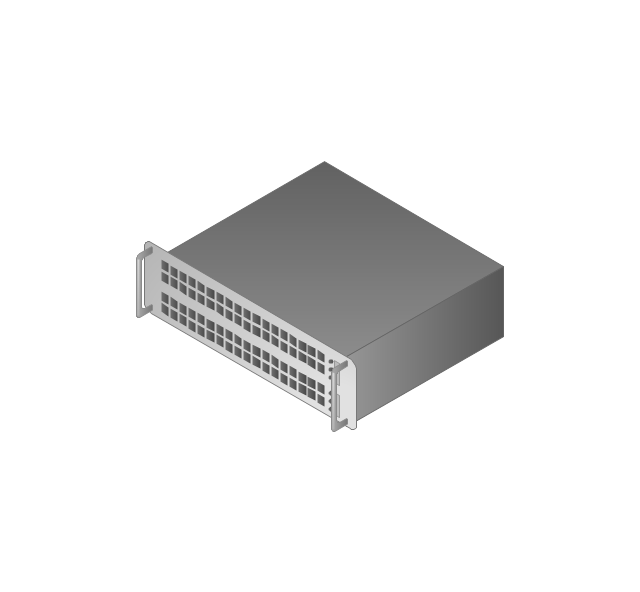
The vector stencils library "Computers and network isometric" contains 56 3D clipart images of computer and network devices and equipment for drawing network diagrams.
The clip art example "Computers and network isometric - Vector stencils library" was created using the ConceptDraw PRO diagramming and vector drawing software extended with the Computer and Networks solution from the Computer and Networks area of ConceptDraw Solution Park.
The clip art example "Computers and network isometric - Vector stencils library" was created using the ConceptDraw PRO diagramming and vector drawing software extended with the Computer and Networks solution from the Computer and Networks area of ConceptDraw Solution Park.
Laptop

DDCS

Server
Webcam
Wireless Network Storage
Personal computer

VoIP phone
Fax
Plotter
Mobile phone
Feature phone

Printer
Satellite dish

Satellite antenna
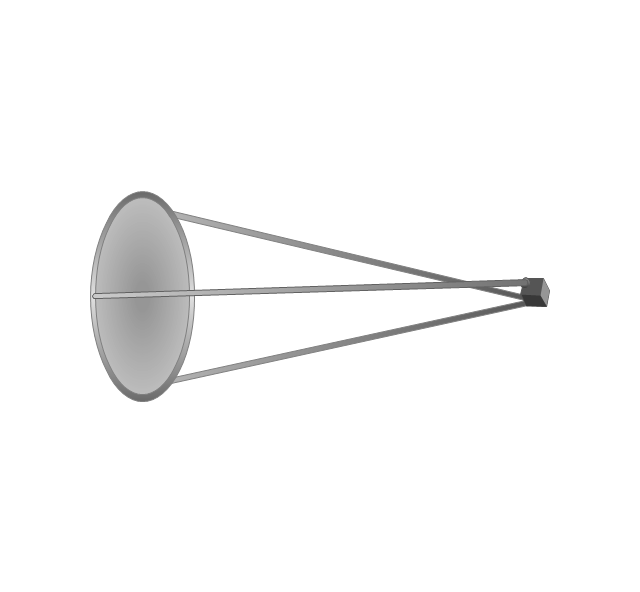
Automatic-tracking satellite dish
Wireless access point
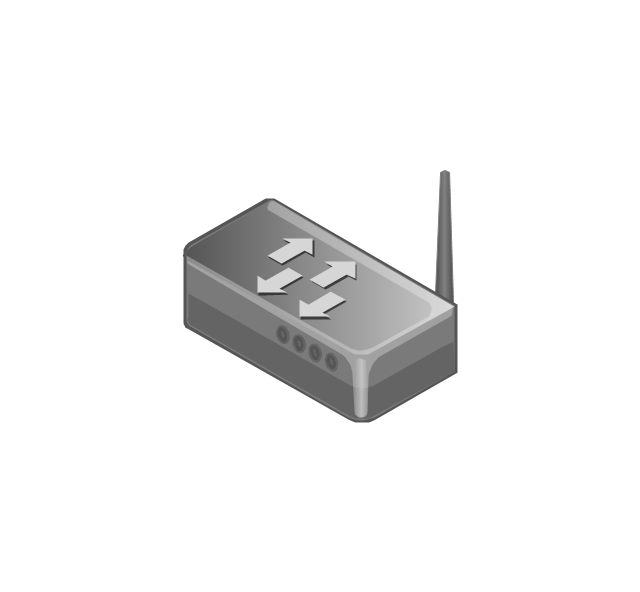
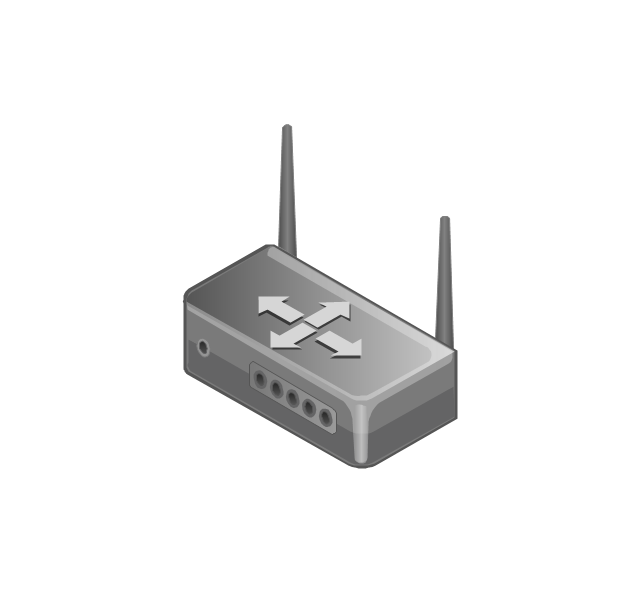
Wireless router
Router
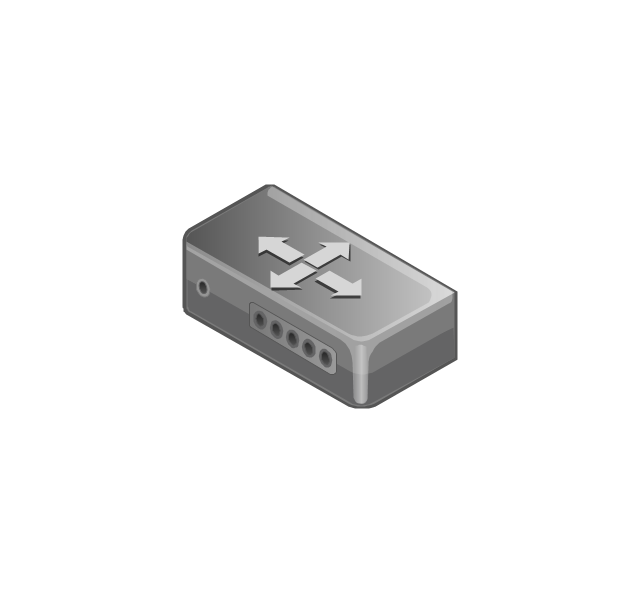
Network switch
Network device
Mobile GPS Terminal
GPS phone
Television antenna
Radio tower

Base station

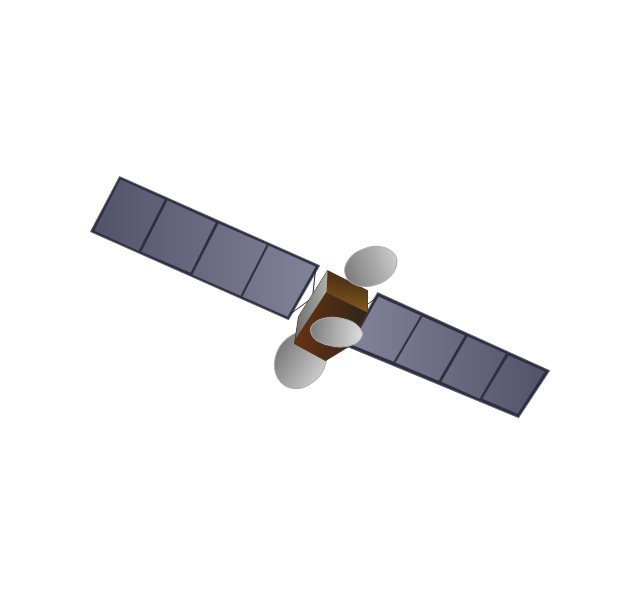
Satellite
In-vehicle satellite telecommunication

Satellite dishes on ship

Airplane

Internet

Man

Woman

Call-center

Honeycomb

Mountain

Radio waves

Radio waves

Tower block
Office building

House

House

Globe

Wireless security camera
Truck
Tree

Conifer tree

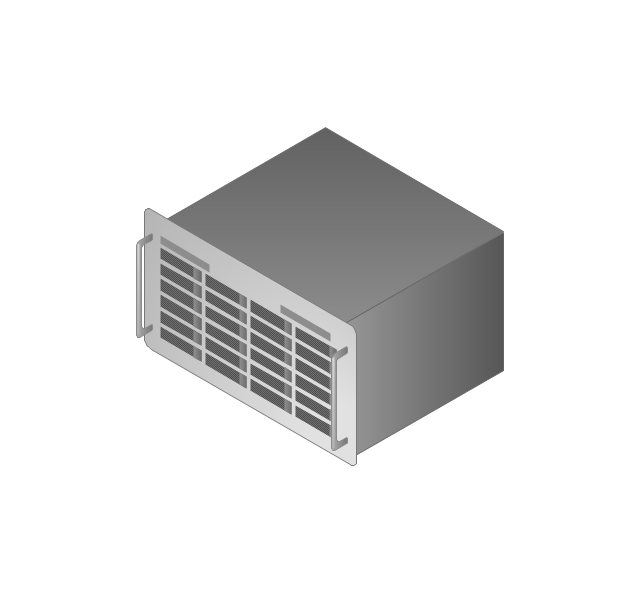
1U hub / switch
2U hub / switch
1U server

2U Server
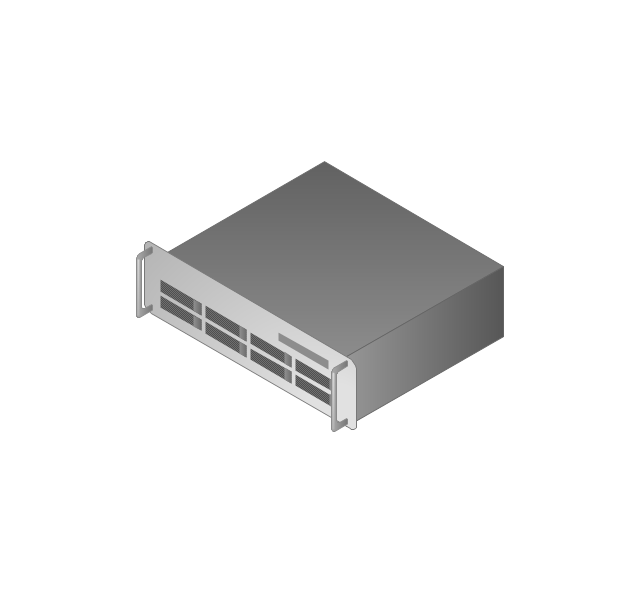
3U Server
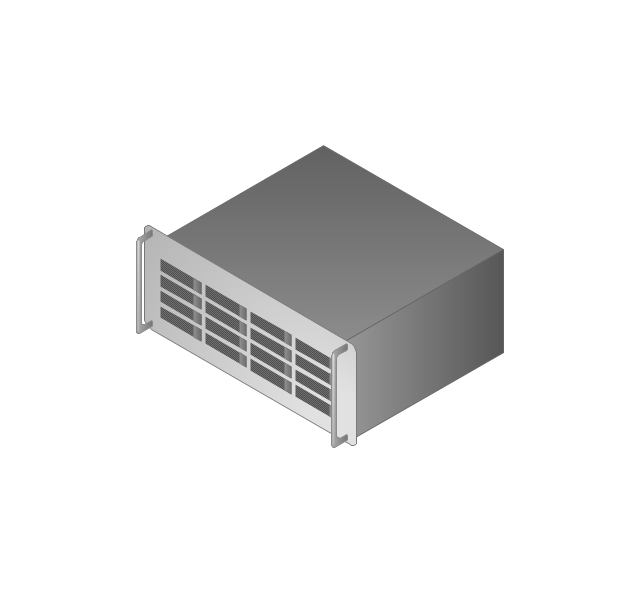
4U Server
Communications satellite
Car

Radio waves

Firewall

ConceptDraw DIAGRAM is an Advanced tool for Professional Network Diagrams Creation

Using Both Wired and Wireless Connections

Daisy Chain Network Topology

A Daisy Chain is the simple computer network. It is the easiest way to add more Ethernet devices into the network. In the Daisy Chain network one computer is connected to the next without any intervening devices, thus the message is sent from one computer to the next and then to the next and so on. A Daisy Chain can be linear or ring
Computer Hardware - Reseller Business Plan

 Network Layout Floor Plans
Network Layout Floor Plans solution extends ConceptDraw DIAGRAM software functionality with powerful tools for quick and efficient documentation the network equipment and displaying its location on the professionally designed Network Layout Floor Plans. Never before creation of Network Layout Floor Plans, Network Communication Plans, Network Topologies Plans and Network Topology Maps was not so easy, convenient and fast as with predesigned templates, samples, examples and comprehensive set of vector design elements included to the Network Layout Floor Plans solution. All listed types of plans will be a good support for the future correct cabling and installation of network equipment.
This work flow chart sample was redesigned from the picture "Weather Forecast" from the article "Simulation Workflows".
[iaas.uni-stuttgart.de/ forschung/ projects/ simtech/ sim-workflows.php]
"(1) The weather is predicted for a particular geological area. Hence, the workflow is fed with a model of the geophysical environment of ground, air and water for a requested area.
(2) Over a specified period of time (e.g. 6 hours) several different variables are measured and observed. Ground stations, ships, airplanes, weather balloons, satellites and buoys measure the air pressure, air/ water temperature, wind velocity, air humidity, vertical temperature profiles, cloud velocity, rain fall, and more.
(3) This data needs to be collected from the different sources and stored for later access.
(4) The collected data is analyzed and transformed into a common format (e.g. Fahrenheit to Celsius scale). The normalized values are used to create the current state of the atmosphere.
(5) Then, a numerical weather forecast is made based on mathematical-physical models (e.g. GFS - Global Forecast System, UKMO - United Kingdom MOdel, GME - global model of Deutscher Wetterdienst). The environmental area needs to be discretized beforehand using grid cells. The physical parameters measured in Step 2 are exposed in 3D space as timely function. This leads to a system of partial differential equations reflecting the physical relations that is solved numerically.
(6) The results of the numerical models are complemented with a statistical interpretation (e.g. with MOS - Model-Output-Statistics). That means the forecast result of the numerical models is compared to statistical weather data. Known forecast failures are corrected.
(7) The numerical post-processing is done with DMO (Direct Model Output): the numerical results are interpolated for specific geological locations.
(8) Additionally, a statistical post-processing step removes failures of measuring devices (e.g. using KALMAN filters).
(9) The statistical interpretation and the numerical results are then observed and interpreted by meteorologists based on their subjective experiences.
(10) Finally, the weather forecast is visualized and presented to interested people." [iaas.uni-stuttgart.de/ forschung/ projects/ simtech/ sim-workflows.php]
The example "Workflow diagram - Weather forecast" was drawn using the ConceptDraw PRO diagramming and vector drawing software extended with the Workflow Diagrams solution from the Business Processes area of ConceptDraw Solution Park.
Work flow chart

- 3d House Computer Graphics Project Flow Chart
- Pyramid Diagram | How to Create a Pyramid Diagram | Pyramid ...
- Computer Network Diagrams | Computer Wan Model School ...
- Sample Project Flowchart. Flowchart Examples | Flowchart design ...
- Network Layout Floor Plans | Local area network (LAN). Computer ...
- Call center network diagram | Computers and network isometric ...
- Network Drawing Software | Network Layout | Network Diagram ...
- AWS Architecture Diagrams | Sample Project Flowchart. Flowchart ...
- Venn Diagram Examples for Problem Solving. Computer Science ...
- Matrix Organization Structure | Orgchart | Prioritization Matrix | 3d ...
- How To use House Electrical Plan Software | Guesthouse Network ...
- How To Add a Computer Network Diagram to a PowerPoint ...
- Hybrid Network Topology | Lan Man Wan Thermocol Project
- Computer Project Lan And Wan For Kid Easily Draw
- Cisco Routers. Cisco icons, shapes, stencils and symbols | Cisco ...
- Basic Network Diagram | Local area network (LAN). Computer and ...
- Wireless Network Project Proposal Sample
- Cisco Routers. Cisco icons, shapes, stencils and symbols | Network ...
- Cisco Network Diagram Software | How To Convert a ...
- Network Drawing Software | 3D Network Diagram Software | GPRS ...
- ERD | Entity Relationship Diagrams, ERD Software for Mac and Win
- Flowchart | Basic Flowchart Symbols and Meaning
- Flowchart | Flowchart Design - Symbols, Shapes, Stencils and Icons
- Flowchart | Flow Chart Symbols
- Electrical | Electrical Drawing - Wiring and Circuits Schematics
- Flowchart | Common Flowchart Symbols
- Flowchart | Common Flowchart Symbols