Flowchart Components

UML Component Diagram Example - Online Shopping

This sample shows the concept of the online shopping and is used for the understanding of the online shopping processes, of the online shops working processes, for projection and creating of the online stores.
Components of ER Diagram

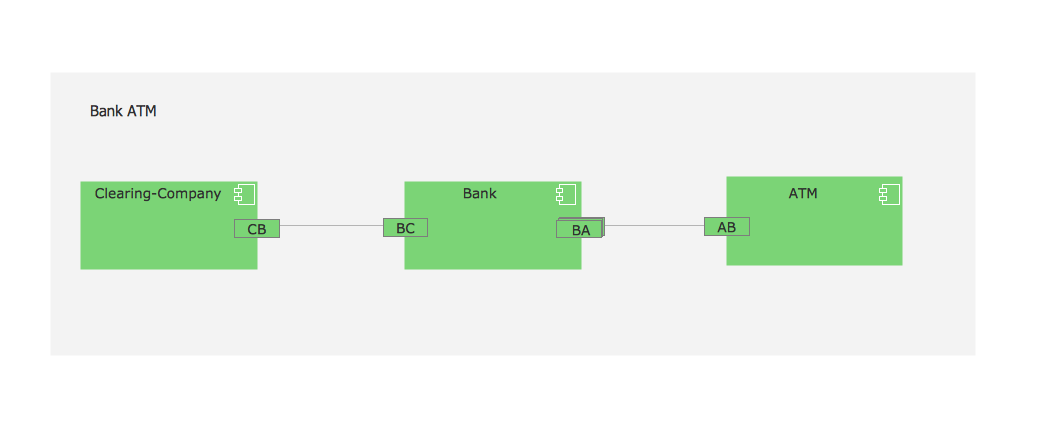
UML Component for Bank
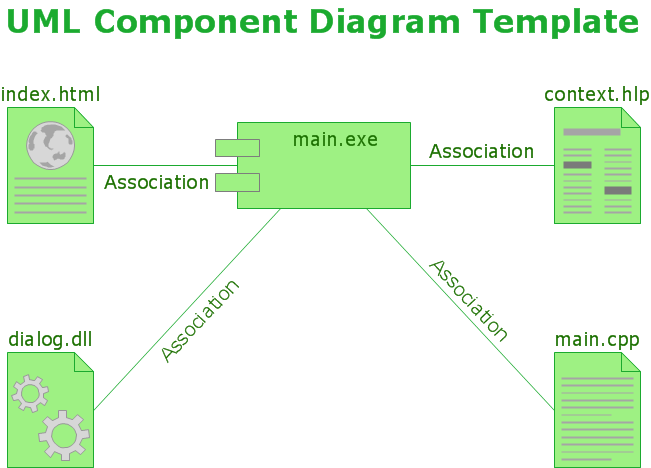
UML Component Diagram

Identifying Quality Management System

Stakeholder Management System

ConceptDraw DIAGRAM is a powerful diagramming and vector drawing software. Now, thanks to the Stakeholder Onion Diagrams Solution included to the Management Area of ConceptDraw Solution Park, ConceptDraw DIAGRAM became also unique stakeholder management system design software.
"A document management system (DMS) is a computer system (or set of computer programs) used to track and store electronic documents. It is usually also capable of keeping track of the different versions modified by different users (history tracking). The term has some overlap with the concepts of content management systems. It is often viewed as a component of enterprise content management (ECM) systems and related to digital asset management, document imaging, workflow systems and records management systems. ...
Document management systems commonly provide storage, versioning, metadata, security, as well as indexing and retrieval capabilities." [Document management system. Wikipedia]
The block diagram example "Document management system architecture" was created using the ConceptDraw PRO diagramming and vector drawing software extended with the Block Diagrams solution from the area "What is a Diagram" of ConceptDraw Solution Park.
System architecture diagram

Interaction Overview Diagram

Data Flow Diagram

- Component Management System
- Component Diagram For Event Management System
- Flowchart Components | Simon Flowchart Of Management System
- Draw Component Diagram Of Library Management System
- Component Diagram Of Online Event Management System
- Components Of Library Management System
- Component Diagram For Accounting Management System
- Component Diagram For Library Management System Pdf
- Component Diagram For Cab Management System
- Rapid UML | Component Diagram For Atm Management System In ...
- ERD | Entity Relationship Diagrams, ERD Software for Mac and Win
- Flowchart | Basic Flowchart Symbols and Meaning
- Flowchart | Flowchart Design - Symbols, Shapes, Stencils and Icons
- Flowchart | Flow Chart Symbols
- Electrical | Electrical Drawing - Wiring and Circuits Schematics
- Flowchart | Common Flowchart Symbols
- Flowchart | Common Flowchart Symbols