Network Diagram Examples


The PERT chart shows the logical connections and consequence of a set of tasks. PERT charts the time period for problem solving and the implementation plan for all activities along the critical path. The PERT chart is also known as a precedence diagram or project network diagram.
"The Program (or Project) Evaluation and Review Technique, commonly abbreviated PERT, is a statistical tool, used in project management, that is designed to analyze and represent the tasks involved in completing a given project. ...
PERT is a method to analyze the involved tasks in completing a given project, especially the time needed to complete each task, and to identify the minimum time needed to complete the total project.
PERT was developed primarily to simplify the planning and scheduling of large and complex projects. ...
A network diagram can be created by hand or by using diagram software. There are two types of network diagrams, activity on arrow (AOA) and activity on node (AON). Activity on node diagrams are generally easier to create and interpret." [Program Evaluation and Review Technique. Wikipedia]
The PERT chart is one of the Seven Management and Planning Tools (7 MP tools, Seven New Quality Tools).
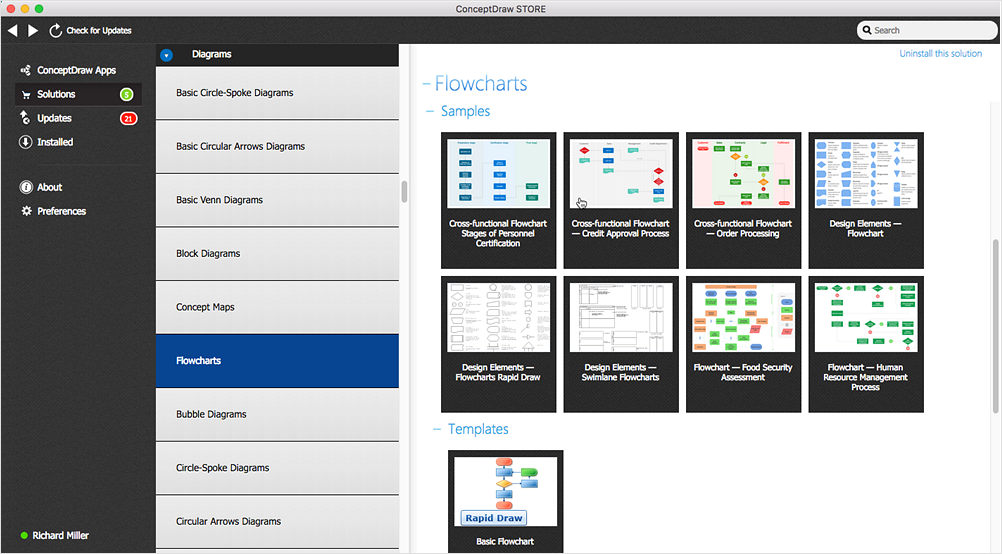
The PERT chart template for the ConceptDraw PRO diagramming and vector drawing software is included in the solution "Seven Management and Planning Tools" from the Management area of ConceptDraw Solution Park.
"The Program (or Project) Evaluation and Review Technique, commonly abbreviated PERT, is a statistical tool, used in project management, that is designed to analyze and represent the tasks involved in completing a given project. ...
PERT is a method to analyze the involved tasks in completing a given project, especially the time needed to complete each task, and to identify the minimum time needed to complete the total project.
PERT was developed primarily to simplify the planning and scheduling of large and complex projects. ...
A network diagram can be created by hand or by using diagram software. There are two types of network diagrams, activity on arrow (AOA) and activity on node (AON). Activity on node diagrams are generally easier to create and interpret." [Program Evaluation and Review Technique. Wikipedia]
The PERT chart is one of the Seven Management and Planning Tools (7 MP tools, Seven New Quality Tools).
The PERT chart template for the ConceptDraw PRO diagramming and vector drawing software is included in the solution "Seven Management and Planning Tools" from the Management area of ConceptDraw Solution Park.
PERT chart template

Legend

HelpDesk
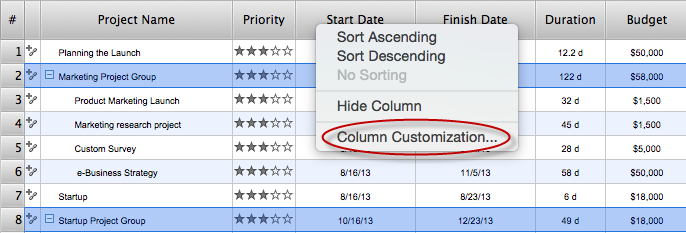
What Information can be Displayed in the Multiproject Dashboard View
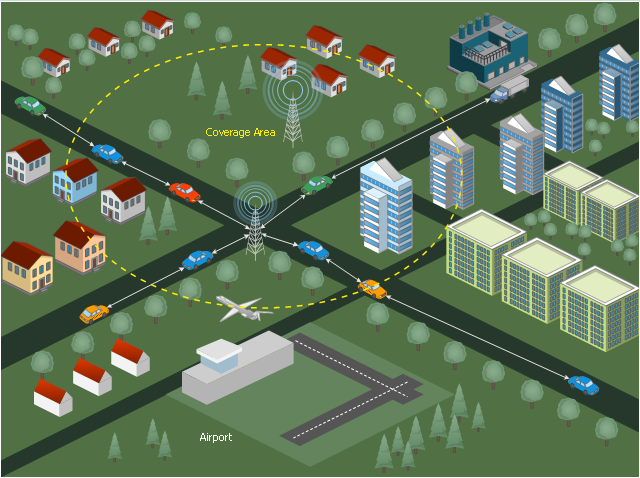
This diagram sample illustrates the cooperative vehicular delay-tolerant network operation.
"Delay-tolerant networking (DTN) is an approach to computer network architecture that seeks to address the technical issues in heterogeneous networks that may lack continuous network connectivity. Examples of such networks are those operating in mobile or extreme terrestrial environments, or planned networks in space.
Recently, the term disruption-tolerant networking has gained currency in the United States due to support from DARPA, which has funded many DTN projects. Disruption may occur because of the limits of wireless radio range, sparsity of mobile nodes, energy resources, attack, and noise." [Delay-tolerant networking. Wikipedia]
"Routing in delay-tolerant networking concerns itself with the ability to transport, or route, data from a source to a destination, which is a fundamental ability all communication networks must have. Delay- and disruption-tolerant networks (DTNs) are characterized by their lack of connectivity, resulting in a lack of instantaneous end-to-end paths. In these challenging environments, popular ad hoc routing protocols such as AODV and DSR fail to establish routes. This is due to these protocols trying to first establish a complete route and then, after the route has been established, forward the actual data. However, when instantaneous end-to-end paths are difficult or impossible to establish, routing protocols must take to a "store and forward" approach, where data is incrementally moved and stored throughout the network in hopes that it will eventually reach its destination. A common technique used to maximize the probability of a message being successfully transferred is to replicate many copies of the message in hopes that one will succeed in reaching its destination." [Routing in delay-tolerant networking. Wikipedia]
The example "Cooperative vehicular delay-tolerant network diagram" was created using the ConceptDraw PRO diagramming and vector drawing software extended with the Vehicular Networking solution from the Computer and Networks area of ConceptDraw Solution Park.
Vehicular network diagram
HelpDesk
What Information to be Displayed in the ConceptDraw PROJECT Gantt Chart View

HelpDesk
Download and Install ConceptDraw OFFICE on Mac
HelpDesk
How are Summary Values of Project Phases Calculated

HelpDesk
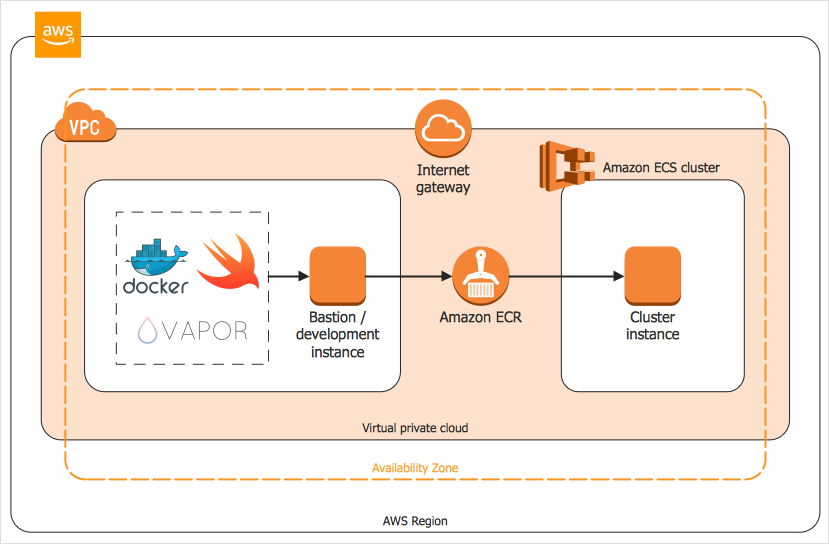
How to Create an AWS Architecture Diagram
 ConceptDraw Solution Park
ConceptDraw Solution Park collects graphic extensions, examples and learning materials
- Complete Network Topology | Fully Connected Network Topology ...
- Fully Connected Network Topology Diagram | Complete Network ...
- Network Topologies | Fully Connected Network Topology Diagram ...
- Star Network Topology | Network Topologies | Complete Network ...
- Network Topology Graphical Examples | Grid Network Topology ...
- Daisy Chain Network Topology | Hotel Network Topology Diagram ...
- Network Topologies | Complete Network Topology | Process ...
- Hybrid Network Topology | Star Network Topology | Complete ...
- Fully Connected Network Topology Diagram | Star Network ...
- Daisy Chain Network Topology | Complete Network Topology ...
- Network Topologies | Plant Layout Plans | Cisco Design | Complete ...
- How To Complete Network Di
- Complete Topology In Networking
- Fully Connected Network Topology Diagram | Network Topologies ...
- Wireless Network Topology | Hotel Network Topology Diagram ...
- Point to Point Network Topology
- Network Topologies | Fully Connected Network Topology Diagram ...
- Fully Connected Network Topology Diagram | Network Topologies ...
- Tree Network Topology Diagram | Network Topologies | Fully ...
- Visio Look a Like Diagrams | Network Topologies | Network ...
- ERD | Entity Relationship Diagrams, ERD Software for Mac and Win
- Flowchart | Basic Flowchart Symbols and Meaning
- Flowchart | Flowchart Design - Symbols, Shapes, Stencils and Icons
- Flowchart | Flow Chart Symbols
- Electrical | Electrical Drawing - Wiring and Circuits Schematics
- Flowchart | Common Flowchart Symbols
- Flowchart | Common Flowchart Symbols