"SWOT is a handy mnemonic to help corporate planners think about strategy. It stands for Strengths, Weaknesses, Opportunities and Threats. What are an organisation's SWOTs? How can it manage them in a way that will optimise its performance? A second four-letter acronym is sometimes brought into play here: USED. How can the Strengths be Used; the Weaknesses be Stopped, the Opportunities be Exploited; and the Threats be Defended against? ...
A SWOT analysis can be applied to different aspects of a company's business, such as its it capability or its skills. The simplicity and intuitive wholeness of the framework have helped to make it extremely popular with both corporations and governments." [economist.com/ node/ 14301503]
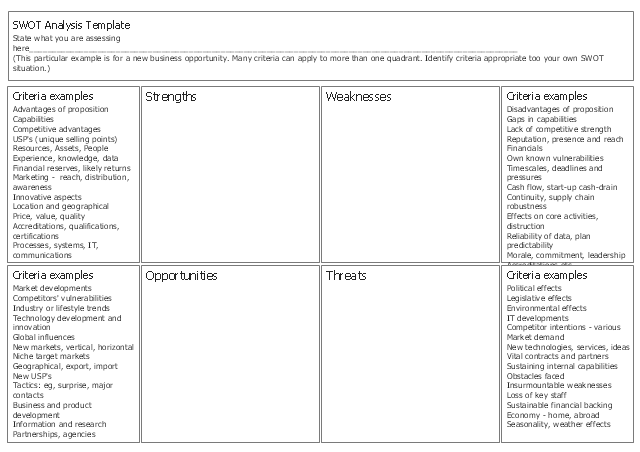
This form template "New business opportunity SWOT analysis matrix" for the ConceptDraw PRO diagramming and vector drawing software is included in the SWOT Analysis solution from the Management area of ConceptDraw Solution Park.
A SWOT analysis can be applied to different aspects of a company's business, such as its it capability or its skills. The simplicity and intuitive wholeness of the framework have helped to make it extremely popular with both corporations and governments." [economist.com/ node/ 14301503]
This form template "New business opportunity SWOT analysis matrix" for the ConceptDraw PRO diagramming and vector drawing software is included in the SWOT Analysis solution from the Management area of ConceptDraw Solution Park.
SWOT matrix template

"SWOT Analysis.
A way to identify and analyze a company's goals by assessing its strength, weaknesses, opportunities, and threats. An advantage to SWOT analysis is that it separates internal factors (strengths and weaknesses) from external ones (opportunities and threats). This allows the company to match what it could do in theory with what is possible in reality. Another advantage is the fact that conducting SWOT analysis is straightforward if the company conducting it is honest with itself." [financial-dictionary.thefreedictionary.com/ SWOT+Analysis]
This form template "New business opportunity SWOT analysis matrix" for the ConceptDraw PRO diagramming and vector drawing software is included in the SWOT Analysis solution from the Management area of ConceptDraw Solution Park.
SWOT matrix template
HelpDesk
How to Make an Ansoff Matrix Template

 Matrices
This solution extends ConceptDraw DIAGRAM software with samples, templates and library of design elements for drawing the business matrix diagrams.
 SWOT and TOWS Matrix Diagrams
SWOT and TOWS Matrix Diagrams solution extends ConceptDraw DIAGRAM and ConceptDraw MINDMAP software with features, templates, samples and libraries of vector stencils for drawing SWOT and TOWS analysis matrices and mind maps.
Bubble diagrams in Landscape Design with ConceptDraw DIAGRAM

 Seven Management and Planning Tools
Seven Management and Planning Tools solution extends ConceptDraw DIAGRAM and ConceptDraw MINDMAP with features, templates, samples and libraries of vector stencils for drawing management mind maps and diagrams.
 Marketing Area
The solutions from Marketing area of ConceptDraw Solution Park collect templates, samples and libraries of vector stencils for drawing the marketing diagrams and mind maps.
HelpDesk
How to Create an Enterprise Architecture Diagram

 Sport Field Plans
Sport Field Plans solution extends ConceptDraw DIAGRAM with samples, templates and libraries of ready-made design elements for developing layouts of sport fields, recreation areas, playground layouts plans, and for professional drawing various sport field plans — for football, basketball, volleyball, golf, baseball, tennis, etc. Depict all your playground layout ideas easily and decisively implement the playground layout designs. Use the final colorful, strict and accurate ConceptDraw's playground layouts when designing the building documentation, brochures, booklets, advertising materials, sports editions, sport maps, business plans, on web sites of sport complexes, sport centers, hotels, etc.
HelpDesk
How to Draw a Fishbone Diagram

- Competitive Landscape Analysis Template
- Marketing Area | Matrices | Competitive Landscape Graph
- Matrix Organization Structure | How to Draw a Matrix Organizational ...
- Competitive Analysis Feature Matrix
- New business opportunity SWOT analysis matrix - Template ...
- SWOT Analysis | New business opportunity SWOT analysis matrix ...
- SWOT Matrix Template | TOWS analysis matrix - Template | SWOT ...
- New business opportunity SWOT analysis matrix - Template portrait ...
- SWOT analysis for a small independent bookstore | Competitor ...
- SWOT Analysis | TOWS Analysis | SWOT Matrix | Swot Analysis For ...
- SWOT Matrix Template | SWOT Template | SWOT Analysis ...
- SWOT Matrix Template
- New business opportunity SWOT analysis matrix - Template ...
- SWOT Matrix Template | How to Create a SWOT Matrix Quickly ...
- Flowchart Example: Flow Chart of Marketing Analysis | Competitor ...
- Business Tools Perceptual Mapping | Matrices | Competitor Analysis ...
- Competitor Analysis | Tools to Create Your Own Infographics ...
- SWOT Analysis | SWOT analysis for a small independent bookstore ...
- SWOT Analysis | SWOT Template | TOWS Matrix | Tows Matrix ...
- SWOT Matrix Template | SWOT analysis positioning matrix ...
- ERD | Entity Relationship Diagrams, ERD Software for Mac and Win
- Flowchart | Basic Flowchart Symbols and Meaning
- Flowchart | Flowchart Design - Symbols, Shapes, Stencils and Icons
- Flowchart | Flow Chart Symbols
- Electrical | Electrical Drawing - Wiring and Circuits Schematics
- Flowchart | Common Flowchart Symbols
- Flowchart | Common Flowchart Symbols