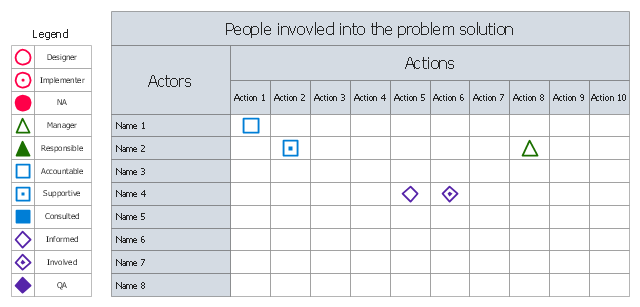
The involvement matrix (responsibility assignment matrix, RAM, RACI matrix, ARCI matrix, linear responsibility chart, LRC) defines the level of involvement and nature of participation . The diagram shows the degree of involvement for all identified parties in the execution of corrective actions.
"Key responsibility roles.
Responsible.
Those who do the work to achieve the task. There is at least one role with a participation type of responsible, although others can be delegated to assist in the work required (see also RASCI below for separately identifying those who participate in a supporting role).
Accountable (also approver or final approving authority).
The one ultimately answerable for the correct and thorough completion of the deliverable or task, and the one who delegates the work to those responsible. In other words, an accountable must sign off (approve) on work that responsible provides. There must be only one accountable specified for each task or deliverable.
Consulted (sometimes counsel).
Those whose opinions are sought, typically subject matter experts; and with whom there is two-way communication.
Informed.
Those who are kept up-to-date on progress, often only on completion of the task or deliverable; and with whom there is just one-way communication." [Responsibility assignment matrix. Wikipedia]
The involvement matrix is one of the Seven Management and Planning Tools (7 MP tools, Seven New Quality Tools).
The person involvement matrix template for the ConceptDraw PRO diagramming and vector drawing software is included in the solution "Seven Management and Planning Tools" from the Management area of ConceptDraw Solution Park.
Person involvement matrix
Authority Matrix Diagram Software

ConceptDraw PRO extended with Seven Management and Planning Tools solution from the Management Area is the best Authority Matrix Diagram Software.
PROBLEM ANALYSIS. Prioritization Matrix


 AWS Architecture Diagrams
AWS Architecture Diagrams with powerful drawing tools and numerous predesigned Amazon icons and AWS simple icons is the best for creation the AWS Architecture Diagrams, describing the use of Amazon Web Services or Amazon Cloud Services, their application for development and implementation the systems running on the AWS infrastructure. The multifarious samples give you the good understanding of AWS platform, its structure, services, resources and features, wide opportunities, advantages and benefits from their use; solution’s templates are essential and helpful when designing, description and implementing the AWS infrastructure-based systems. Use them in technical documentation, advertising and marketing materials, in specifications, presentation slides, whitepapers, datasheets, posters, etc.
Basic Flowchart Symbols and Meaning


 Security and Access Plans
This solution extends ConceptDraw PRO software with physical security plan, security chart, access chart, security plans, access schemes, access plans , CCTV System Plan samples, templates and libraries of design elements for drawing the Security and Acce
HelpDesk
How To Create an Involvement Matrix

TOWS Analysis Software

ConceptDraw PRO diagramming and vector drawing software extended with SWOT and TOWS Matrix Diagrams Solution from the Management Area is the best for realization TOWS analysis and for quick and easy construction TOWS Matrix.
Business Process Flowchart Symbols

Organizational Chart Template

Pie Donut Chart. Pie Chart Examples

The Pie Donut Chart visualizes the percentage of parts of the whole and looks like as a ring divided into sectors. Pie Donut Charts are widely used in the business, statistics, analytics, mass media.
How to Create a Pie Chart

Pie Chart Examples and Templates

Pie chart examples and templates created using ConceptDraw PRO software helps you get closer with pie charts and find pie chart examples suite your needs.
 Cafe and Restaurant Floor Plans
Restaurants and cafes are popular places for recreation, relaxation, and are the scene for many impressions and memories, so their construction and design requires special attention. Restaurants must to be projected and constructed to be comfortable and e
Column Chart Template

- Communication Matrix Legend
- Matrix Legend
- Organizational Communication Matrix
- Corporate Structure Chart Legend
- Responsibility assignment matrix - Central statistical office | Person ...
- Responsibility assignment matrix - Central statistical office | Person ...
- Communication Matrix Sample
- The Action Plan | Responsibility assignment matrix - Central ...
- Person involvement matrix - Template | Design elements ...
- Cctv Camera Legend
- How To Create an Involvement Matrix | CORRECTIVE ACTIONS ...
- Person involvement matrix - Template | Involvement matrix - Sale ...
- Person involvement matrix - Template | How To Create an ...
- Person involvement matrix - Template | 3D Column chart - Iran ...
- Person involvement matrix - Template | Horizontal Flowchart ...
- Organogram Software | Person involvement matrix - Template ...
- Responsibility assignment matrix - Central statistical office ...
- Person involvement matrix - Template | Process Flowchart | Raci ...
- PROBLEM ANALYSIS. Prioritization Matrix | Person involvement ...
- Responsibility assignment matrix - Central statistical office ...
- ERD | Entity Relationship Diagrams, ERD Software for Mac and Win
- Flowchart | Basic Flowchart Symbols and Meaning
- Flowchart | Flowchart Design - Symbols, Shapes, Stencils and Icons
- Flowchart | Flow Chart Symbols
- Electrical | Electrical Drawing - Wiring and Circuits Schematics
- Flowchart | Common Flowchart Symbols
- Flowchart | Common Flowchart Symbols