Flowchart on Bank. Flowchart Examples

This sample shows the Flowchart of the Subprime Mortgage Crisis. This Flowchart describes the decline in housing prices when the housing bubble burst and what it caused on the housing and financial markets. You can also see the Government and Industry responses in this crisis situation.

Approval Process and Segregation of Responsibilities Accounting Flowchart Example

Organizational Chart

Flowchart

Accounting Flowchart Symbols

How to Create Flowcharts for an Accounting Information System

Flowcharts help users of Accounting Information System to understand the step sequences of accounting processes. Use ConceptDraw DIAGRAM with Accounting Flowcharts solution to document and communicate visually how accounting processes work, and how each operation is done.
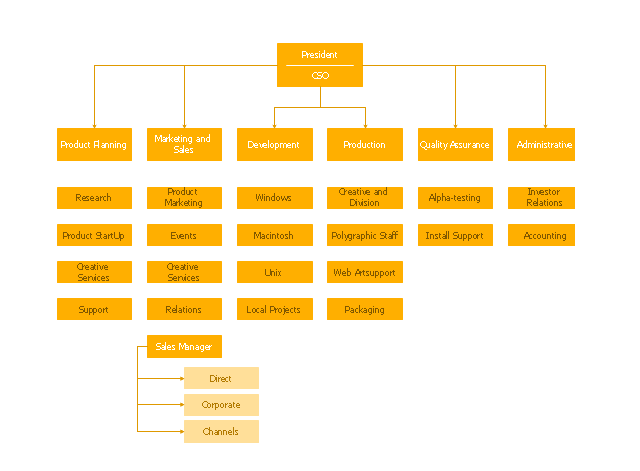
"A hierarchical organization is an organizational structure where every entity in the organization, except one, is subordinate to a single other entity. This arrangement is a form of a hierarchy. In an organization, the hierarchy usually consists of a singular/ group of power at the top with subsequent levels of power beneath them. This is the dominant mode of organization among large organizations; most corporations, governments, and organized religions are hierarchical organizations with different levels of management, power or authority. ... Members of hierarchical organizational structures chiefly communicate with their immediate superior and with their immediate subordinates. Structuring organizations in this way is useful partly because it can reduce the communication overhead by limiting information flow; this is also its major limitation." [Hierarchical organization. Wikipedia]
"A company's organizational chart typically illustrates relations between people within an organization. Such relations might include managers to sub-workers, directors to managing directors, chief executive officer to various departments, and so forth. When an organization chart grows too large it can be split into smaller charts for separate departments within the organization. The different types of organization charts include: Hierarchical, Matrix, Flat (also known as Horizontal)." [Organizational chart. Wikipedia]
The org chart sample "Hierarchical organization" was created using the ConceptDraw PRO diagramming and vector drawing software extended with the 25 Typical Organizational Charts solution from the Management area of ConceptDraw Solution Park.
Org chart
EPC Diagrams Illustrate Business Process Work Flows

Pyramid Diagram

Examples of Flowcharts, Org Charts and More


How to Draw an Organization Chart

While making the drawing process easier and faster.
Video tutorial on creating orgchart with ConceptDraw products. Try ConceptDraw for creating orgchart professional presentations!
Example of Organizational Chart


Diagramming Software for Design UML Collaboration Diagrams


Organizational Structure Total Quality Management

Gantt Chart Templates

ConceptDraw PROJECT lets you the useful possibility to create visual project dashboards and diagrams, generate various kinds of reports with one click. It provides also extensive capabilities of importing and exporting in various formats: Microsoft Project, ConceptDraw MINDMAP , Mindjet MindManager, PDF file.
Pyramid Diagram

five level pyramid example is included in the Pyramid Diagrams solution from Marketing area of ConceptDraw Solution Park.
Organizational Chart Templates

Use the Organizational Charts Solution for ConceptDraw DIAGRAM to create your own Organizational Charts of any complexity quick, easy and effective.
The Organizational Charts designed with ConceptDraw DIAGRAM are vector graphic documents and are available for reviewing, modifying, converting to a variety of formats (image, HTML, PDF file, MS PowerPoint Presentation, Adobe Flash or MS Visio XML), printing and send via e-mail in one moment.
Business Structure


Why Flowchart Important to Accounting Information System?

Flowcharts are used to represent accounting information in a system. There are special symbols which are used to create accounting flowcharts. Try conceptdraw flowcharting set of symbols to draw a professional charts.
- Process Flowchart | Examples of Flowcharts , Org Charts and More ...
- Organizational Communication Flow Chart
- Flowchart Of Business Communication In Organization
- Construction Project Communication Flow Chart
- Communication Flow Chart Example
- Organizational Structure | Basic Flowchart Symbols and Meaning ...
- Organizational Structure | Examples of Flowcharts , Org Charts and ...
- Define Communication Flow Diagram
- Communication Block Diagram For Organization
- Drawing The Communication Chart
- How to Draw a Matrix Organizational Chart with ConceptDraw PRO ...
- Organogram Software | Organizational Structure | Matrix ...
- Business Process Elements: Expanded Objects | Fishbone Diagram ...
- Network Drawing Software | How to Diagram Sentences in ...
- Flow Chart Of How Communication Flows Between Stakeholders
- Hierarchical organization - Org chart | Organizational chart - New ...
- Diagramming Software for Design UML Communication Diagrams ...
- Business Package for Management | Organizational Setup And ...
- Flow Chart Vertical Communication
- Business diagrams & Org Charts with ConceptDraw DIAGRAM ...
- ERD | Entity Relationship Diagrams, ERD Software for Mac and Win
- Flowchart | Basic Flowchart Symbols and Meaning
- Flowchart | Flowchart Design - Symbols, Shapes, Stencils and Icons
- Flowchart | Flow Chart Symbols
- Electrical | Electrical Drawing - Wiring and Circuits Schematics
- Flowchart | Common Flowchart Symbols
- Flowchart | Common Flowchart Symbols