HelpDesk
How to Create an Active Directory Diagram

The logical diagrams of MS Windows Active Directory structure are used to visually support an enterprise IT infrastructure planning and management. ConceptDraw DIAGRAM allows you to make AD Diagrams quickly and easily using the set of special libraries.
Business diagrams & Org Charts with ConceptDraw DIAGRAM


 Active Directory Diagrams
Active Directory Diagrams solution significantly extends the capabilities of ConceptDraw DIAGRAM software with special Active Directory samples, convenient template and libraries of Active Directory vector stencils, common icons of sites and services, icons of LDPA elements, which were developed to help you in planning and modelling network structures and network topologies, in designing excellently looking Active Directory diagrams, Active Directory Structure diagrams, and Active Directory Services diagram, which are perfect way to visualize detailed structures of Microsoft Windows networks, Active Directory Domain topology, Active Directory Site topology, Organizational Units (OU), and Exchange Server organization.
Bubble diagrams in Landscape Design with ConceptDraw DIAGRAM

"The Time/ Money/ Quality Triangle illustrates an advertising truism, that "you can't have all three." If there is little time or money, then ad quality will suffer. The more time and/ or money that is available to the project, the higher the quality can be. However, the level of quality must be appropriate to the product...not all products should have high-quality ads!" [Advertising/ Strategies. Wikibooks]
This triangular diagram example was redesigned using the ConceptDraw PRO diagramming and vector drawing software from Wikimedia Commons file Time-Quality-Money.png. [commons.wikimedia.org/ wiki/ File:Time-Quality-Money.png]
This file is licensed under the Creative Commons Attribution-Share Alike 3.0 Unported license. [creativecommons.org/ licenses/ by-sa/ 3.0/ deed.en]
The chart sample "Time, quality, money triangle diagram" is included in the Pyramid Diagrams solution from the Marketing area of ConceptDraw Solution Park.
Triangular chart

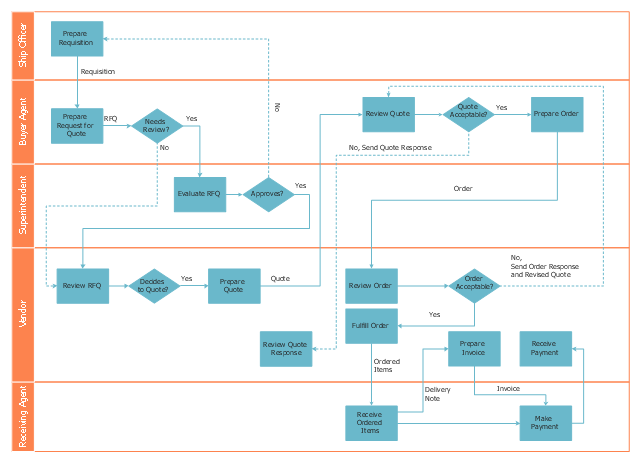
This deployment flow chart sample shows the trading process flow.
"Trade, also called goods exchange economy, is to transfer the ownership of goods from one person or entity to another by getting something in exchange from the buyer. Trade is sometimes loosely called commerce or financial transaction or barter. A network that allows trade is called a market. ...
Modern traders ... generally negotiate through a medium of exchange, such as money. As a result, buying can be separated from selling, or earning. ...
Retail trade consists of the sale of goods or merchandise from a very fixed location, such as a department store, boutique or kiosk, or by mail, in small or individual lots for direct consumption by the purchaser. Wholesale trade is defined as the sale of goods that are sold merchandise to retailers, to industrial, commercial, institutional, or other professional business users, or to other wholesalers and related subordinated services." [Trade. Wikipedia]
The swim lane diagram example "Deployment flowchart - Trading process diagram" was created using the ConceptDraw PRO diagramming and vector drawing software extended with the Cross-Functional Flowcharts solution from the Business Processes area of ConceptDraw Solution Park.
Swim lane diagram
- Commercial Chart Diagram
- Bubbke Diagram For Commercial Design
- Flow chart Example. Warehouse Flowchart | Trading process ...
- Trading process diagram - Deployment flowchart | Financial Trade ...
- Commercial Networking Diagram
- Trading process diagram - Deployment flowchart | Target Diagram ...
- Pyramid Diagram and Pyramid Chart | Online store social media ...
- Social strategy - Pyramid diagram | Pyramid Chart Examples | How ...
- Social strategy - Pyramid diagram | Pyramid Chart Examples ...
- Pyramid Diagram and Pyramid Chart | How to Create a Venn ...
- Marketing Diagrams | Target Diagram | Daily Schedule Chart ...
- Bubble Diagrams | How to Add a Bubble Diagram to a PowerPoint ...
- Marketing Diagrams | Marketing Analysis Diagram | Marketing mix ...
- Social strategy - Pyramid diagram | Online store social media ...
- Retail Management Charts And Diagram
- Trading process diagram - Deployment flowchart | Vertical Cross ...
- Pyramid Chart Examples | Pyramid Diagram | Pyramid Diagram ...
- Diagram For Database Security
- Strategy Diagram Or Concept
- Organizational Structure | Active Directory Domain Services diagram ...
- ERD | Entity Relationship Diagrams, ERD Software for Mac and Win
- Flowchart | Basic Flowchart Symbols and Meaning
- Flowchart | Flowchart Design - Symbols, Shapes, Stencils and Icons
- Flowchart | Flow Chart Symbols
- Electrical | Electrical Drawing - Wiring and Circuits Schematics
- Flowchart | Common Flowchart Symbols
- Flowchart | Common Flowchart Symbols