This agile software development infographic example was designed on the base of the Wikimedia Commons file: Simple-kanban-board-.jpg. [commons.wikimedia.org/ wiki/ File:Simple-kanban-board-.jpg]
This file is licensed under the Creative Commons Attribution-Share Alike 3.0 Unported license. [creativecommons.org/ licenses/ by-sa/ 3.0/ deed.en]
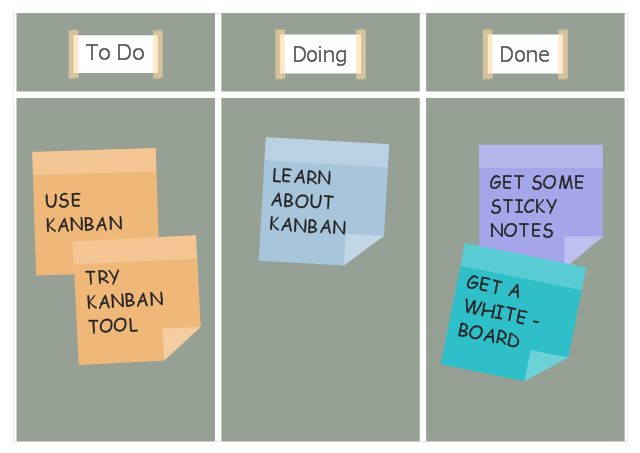
"The basic Scrumban board is composed out of three columns: To Do, Doing and Done. After the planning meeting the tasks are added to the To Do column, when a team member is ready to work on a task, he/ she moves it to the Doing column and when he/ she completes it, he/ she moves it to the Done column. The Scrumban board visually represents the progress of the team. The task board columns are adapted and expanded based on the team's work progress. The most common add-ons include priority columns in the To Do section and columns like Design, Manufacturing, Testing in the Doing section." [Scrumban. Wikipedia]
The infographic sample "Scrum board suggesting to use Kanban" was created using the ConceptDraw PRO software extended with the Scrum solution from the Project Management area of ConceptDraw Solution Park.
This file is licensed under the Creative Commons Attribution-Share Alike 3.0 Unported license. [creativecommons.org/ licenses/ by-sa/ 3.0/ deed.en]
"The basic Scrumban board is composed out of three columns: To Do, Doing and Done. After the planning meeting the tasks are added to the To Do column, when a team member is ready to work on a task, he/ she moves it to the Doing column and when he/ she completes it, he/ she moves it to the Done column. The Scrumban board visually represents the progress of the team. The task board columns are adapted and expanded based on the team's work progress. The most common add-ons include priority columns in the To Do section and columns like Design, Manufacturing, Testing in the Doing section." [Scrumban. Wikipedia]
The infographic sample "Scrum board suggesting to use Kanban" was created using the ConceptDraw PRO software extended with the Scrum solution from the Project Management area of ConceptDraw Solution Park.
Infographic
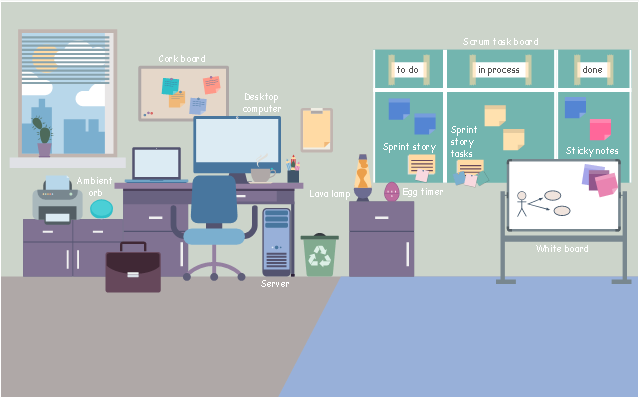
This agile software development infographic example was inspired by Mike Cohn's post "The Ideal Agile Workspace" from the Mountain Goat Software blog.
"... a list of all the things that ... should be visible within the ideal agile workspace:
* Big Visible Charts. ... the sprint burndown chart, showing the number of hours remaining as of each day of the current sprint. ... big visible charts showing the number of passing customer acceptance tests, the pass/ fail status of tests by day, sprint and release burndown charts, number of new stories introduced to the product backlog per sprint ...
* Additional feedback devices. ... a lava lamp that is turned on whenever the automated build is broken. ... flashing red traffic lights to indicate exceptional conditions such as an issue on a production server. ... ambient orbs and Nabaztag rabbits, which are wireless programmable devices that can also be configured to change colors, speak messages, or wiggle their ears as a team desires.
* Everyone on your team. Each person on the team should ideally be able to see each other person on the team. ...
* The sprint backlog. ... The best way to do that is by displaying the sprint backlog on a wall, ideally in the form of a task board A task board is usually oriented in rows and columns with each row containing a particular user story and one index card or sticky note for each task involved in that story. Task cards are organized in columns, minimally including “To Do” “In Process,” and “Done.” ...
* The product backlog. ... tack the index cards with those upcoming user stories on a wall where all can see them. ...
* At least one big white board. ...
* Someplace quiet and private. ...
* Food and drink. ...
* A window." [mountaingoatsoftware.com/ blog/ the-ideal-agile-workspace].
The infographic sample "Scrum workspace" was created using the ConceptDraw PRO software extended with the Scrum solution from the Project Management area of ConceptDraw Solution Park.
Infographic
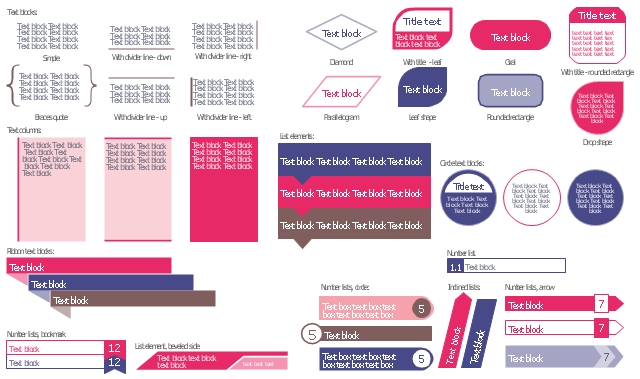
The vector stencils library "Text blocks" contains 38 text blocks including braces quote, blocks with divider line, text columns, list and numbered list elements, inclined list elements, blocks, different shape blocks (arrow, ribbon, circle, rounded rectangle, oval, diamond, parallelogram, leaf, drop), titled text blocks. Use it to add typography elements into your infographics.
The example "Text blocks" was created using the ConceptDraw PRO diagramming and vector drawing software extended with the Typography Infographics solition from the area "What is infographics" in ConceptDraw Solution Park.
The example "Text blocks" was created using the ConceptDraw PRO diagramming and vector drawing software extended with the Typography Infographics solition from the area "What is infographics" in ConceptDraw Solution Park.
Typography infographics elements - Text blocks
HelpDesk
How to Customize the Columns in Your Project File

HelpDesk
What Information to be Displayed in the ConceptDraw PROJECT Gantt Chart View


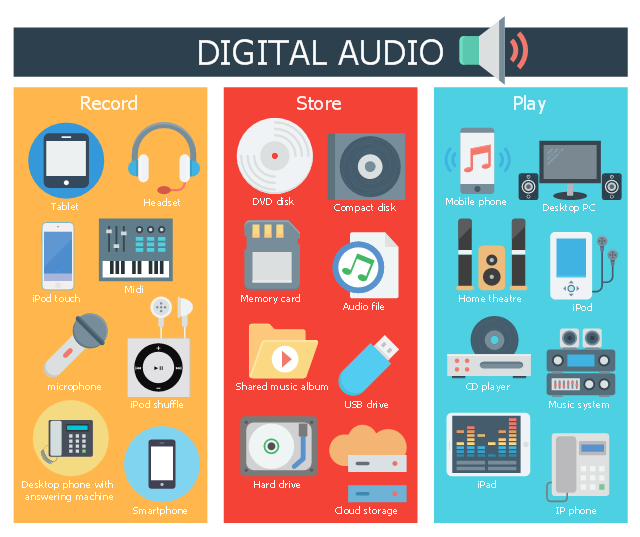
This infographic sample shows digital audio devices for record, store and play of sound and music.
"Digital audio is technology that can be used to record, store, generate, manipulate, and reproduce sound using audio signals that have been encoded in digital form. Following significant advances in digital audio technology during the 1970s, it gradually replaced analog audio technology in many areas of sound production, sound recording (tape systems were replaced with digital recording systems), sound engineering and telecommunications in the 1990s and 2000s." [Digital audio. Wikipedia]
The infographic example "Digital audio" was created using the ConceptDraw PRO diagramming and vector drawing software extended with the Audio, Video, Media solution from the Illustrations area of ConceptDraw Solution Park.
Infographic
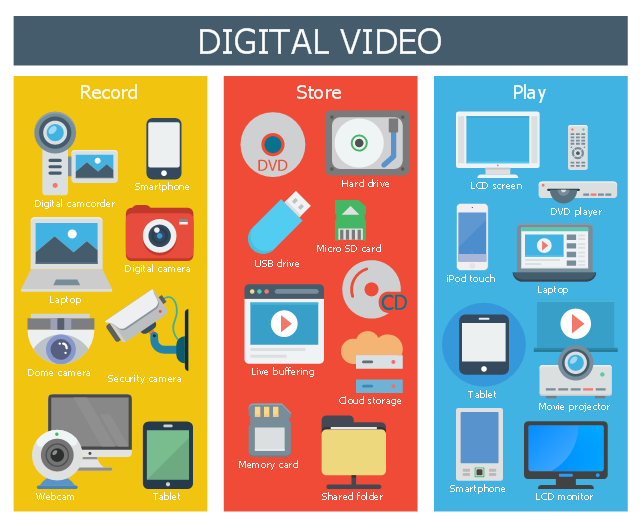
This infographic sample shows digital video devices for video record, store and play.
"Digital video is a representation of moving visual images in the form of encoded digital data. ...
QuickTime, Apple Computer's architecture for time-based and streaming data formats appeared in June, 1991. Initial consumer-level content creation tools were crude, requiring an analog video source to be digitized to a computer-readable format. While low-quality at first, consumer digital video increased rapidly in quality, first with the introduction of playback standards such as MPEG-1 and MPEG-2 (adopted for use in television transmission and DVD media), and then the introduction of the DV tape format allowing recordings in the format to be transferred direct to digital video files (containing the same video data recorded on the transferred DV tape) on an editing computer and simplifying the editing process, allowing non-linear editing systems (NLE) to be deployed cheaply and widely on desktop computers with no external playback/ recording equipment needed, save for the computer simply requiring a FireWire port to interface to the DV-format camera or VCR. The widespread adoption of digital video has also drastically reduced the bandwidth needed for a high-definition video signal (with HDV and AVCHD, as well as several commercial variants such as DVCPRO-HD, all using less bandwidth than a standard definition analog signal) and tapeless camcorders based on flash memory and often a variant of MPEG-4." [Digital video. Wikipedia]
The infographic example "Digital video" was created using the ConceptDraw PRO diagramming and vector drawing software extended with the Audio, Video, Media solution from the Illustrations area of ConceptDraw Solution Park.
Infographic
This infographic sample shows digital audio devices for record, store and play of sound and music.
"Digital audio is technology that can be used to record, store, generate, manipulate, and reproduce sound using audio signals that have been encoded in digital form. Following significant advances in digital audio technology during the 1970s, it gradually replaced analog audio technology in many areas of sound production, sound recording (tape systems were replaced with digital recording systems), sound engineering and telecommunications in the 1990s and 2000s." [Digital audio. Wikipedia]
The infographic example "Digital audio" was created using the ConceptDraw PRO diagramming and vector drawing software extended with the Audio, Video, Media solution from the Illustrations area of ConceptDraw Solution Park.
"Digital audio is technology that can be used to record, store, generate, manipulate, and reproduce sound using audio signals that have been encoded in digital form. Following significant advances in digital audio technology during the 1970s, it gradually replaced analog audio technology in many areas of sound production, sound recording (tape systems were replaced with digital recording systems), sound engineering and telecommunications in the 1990s and 2000s." [Digital audio. Wikipedia]
The infographic example "Digital audio" was created using the ConceptDraw PRO diagramming and vector drawing software extended with the Audio, Video, Media solution from the Illustrations area of ConceptDraw Solution Park.
Infographic
HelpDesk
How to Determine what Information to be Displayed in the Project Resource List

HelpDesk
How to Make a Web Page from Infographics in ConceptDraw PRO

The vector stencils library "Management indicators" contains 14 visual indicators.
Use it to create your management infogram in the ConceptDraw PRO diagramming and vector drawing software.
The example "Management indicators - Vector stencils library" is included in the solution "Marketing infographics" from the "Business infographics" area of ConceptDraw Solution Park.
Use it to create your management infogram in the ConceptDraw PRO diagramming and vector drawing software.
The example "Management indicators - Vector stencils library" is included in the solution "Marketing infographics" from the "Business infographics" area of ConceptDraw Solution Park.
1-Sector donut chart

1-Sector pie chart

2-Bars horizontal bar chart

2-Columns arrow chart
2-Columns arrow chart 2
2-Sectors donut chart

2-Sectors pie chart

Bullet indicator

Progress bar

Radial gauge

Semi-radial gauge

Square chart 10x10 - filling from above

Square chart 10x10 - filling from below

Stickman row pictograph

- Agile Scrum Infographic
- Infographic Donut Chart
- Kanban Workflow Infographic
- Infographic Scrum
- Difference Of Scrum To Kanban Infographics
- Roles on DAD teams | Create Project Vision | Scrum | Infographic ...
- Education infogram - Template | Minnesota measures - Infogram ...
- Bar Graph Infographic Examples For Three Catogories
- Design elements - Text blocks
- Infographic Horizontal Bar
- Horizontal Bar Graph Infographic
- 3D Column chart - Iran internet users per 100 person | Column Chart ...
- Education charts - Vector stencils library | Education infogram 5 ...
- Scrum Workflow | Data Infographics | Scrum | Scrum Infographics
- Tools to Create Your Own Infographics | Design Elements - Data ...
- Scrum Based Development Infographic
- Infographics Bullets
- Kanban Board Software | Conceptual diagram of the Kanban ...
- Basic Flowchart Symbols and Meaning | How to Create a ...
- Agile Scrum Role Infographics
- ERD | Entity Relationship Diagrams, ERD Software for Mac and Win
- Flowchart | Basic Flowchart Symbols and Meaning
- Flowchart | Flowchart Design - Symbols, Shapes, Stencils and Icons
- Flowchart | Flow Chart Symbols
- Electrical | Electrical Drawing - Wiring and Circuits Schematics
- Flowchart | Common Flowchart Symbols
- Flowchart | Common Flowchart Symbols