 ATM UML Diagrams
The ATM UML Diagrams solution lets you create ATM solutions and UML examples. Use ConceptDraw DIAGRAM as a UML diagram creator to visualize a banking system.
 Rapid UML
Rapid UML solution extends ConceptDraw DIAGRAM software with templates, samples and libraries of vector stencils for quick drawing the UML diagrams using Rapid Draw technology.
Interface Design

ConceptDraw DIAGRAM software offers a unique Website Wireframe solution from the Software Development area with all needed tools for fast and easy drawing professional looking website wireframe with attractive interface design.
Think. Act. Accomplish.

Banking System

 Fishbone Diagrams
The Fishbone Diagrams solution extends ConceptDraw DIAGRAM software with the ability to easily draw the Fishbone Diagrams (Ishikawa Diagrams) to clearly see the cause and effect analysis and also problem solving. The vector graphic diagrams produced using this solution can be used in whitepapers, presentations, datasheets, posters, and published technical material.
Types of Flowcharts


Building Drawing Software for Design School Layout

This software could help you to succeed at work if you did engineering job, designing or building.

 Workflow Diagrams
Workflow Diagrams solution extends ConceptDraw DIAGRAM software with samples, templates and vector stencils library for drawing the work process flowcharts.
 Entity-Relationship Diagram (ERD)
An Entity-Relationship Diagram (ERD) is a visual presentation of entities and relationships. That type of diagrams is often used in the semi-structured or unstructured data in databases and information systems. At first glance ERD is similar to a flowch
 Transport Hazard Pictograms
Transport Hazard Pictograms solution includes large variety of specially developed samples with transport hazard symbols and pictograms, and the whole set of predesigned vector transport GHS pictograms download and used with ease from the Transport Hazard Pictograms library. Apply them for quick designing professional-looking infographics and diagrams, use them to create warning signboards and announcements on all stages of the transportation process, to place them on the transport vehicles and warehouses of transportation companies, at the transport documentation and on the websites of transport and logistics companies.
How To Draw Building Plans

Quick building plan software for creating great-looking office layout, home floor, electrical plan, commercial floor plans, Storage building plans, expo and shopping mall building plans, school and training building plans, cafe or restaurant plans, gym and spa area plans, sport field plans, electric and telecom building plans, fire and emergency plans, HVAC plans, security and access plans, plumbing and piping plans and plant layouts.
 Business Diagrams
The Business Diagrams Solution extends ConceptDraw DIAGRAM with an extensive collection of professionally designed illustrative samples and a wide variety of vector stencils libraries, which are the real help for all business-related people, business analysts, business managers, business advisers, marketing experts, PR managers, knowledge workers, scientists, and other stakeholders allowing them to design the bright, neat, expressive and attractive Bubble Diagrams, Circle-Spoke Diagrams, Circular Arrows Diagrams, and Venn Diagrams with different quantity of sets in just minutes; and then successfully use them in documents, reports, statistical summaries, and presentations of any style.
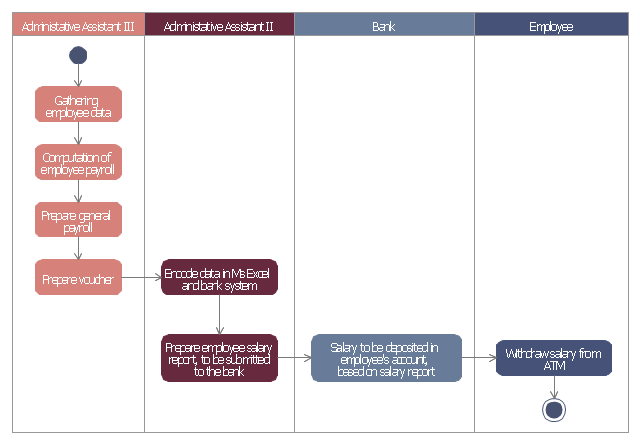
This example of automated payroll management system UML activity diagram was created on the base of figure on the webpage "Automated payroll management system" from ethelmandane.wikispaces.com.
"In the Philippines and in other foreign countries the government has a trend to embrace automation for process efficiency. One of the processes that are being automated is the payroll process. Payroll is the total amount required to pay workers and employees during a week, month or other period.
One of the government offices that desires to automate their payroll system is the NSO Camarines Sur which is located 2nd Floor MMCN Building, Panganiban Avenue, Naga City. The National Statistics Office (NSO) envisions to be recognized as a world-class provider of statistical and civil registration products and services and lives with its mission to produces and provides quality statistical and civil registration products and services. ...
The project seeks to create an Information System Plan for an Automated Payroll Management System. ...
The creation of the Information System Plan will benefit the accounting section of the organization. Specifically it is significant to:
1. Administrative Assistants. It will help to lessen time and effort in preparing and computing the salary of the employee.
2. NSO. It will help the organization to be more productive and efficient."
[ethelmandane.wikispaces.com/ ]
This file is licensed under a Creative Commons Attribution Share-Alike 3.0 License. [creativecommons.org/ licenses/ by-sa/ 3.0/ ]
This UML activity diagram example modeling the automated payroll management system using automated teller machine (ATM) was created using the ConceptDraw PRO diagramming and vector drawing software extended with the ATM UML Diagrams solution from the Software Development area of ConceptDraw Solution Park.
UML activity diagram of automated payroll management system using ATM
 SYSML
SYSML
The SysML solution helps to present diagrams using Systems Modeling Language; a perfect tool for system engineering.
TQM Diagram Example

 School and Training Plans
School and Training Plans solution enhances ConceptDraw DIAGRAM functionality with extensive drawing tools, numerous samples and examples, templates and libraries of classroom design elements for quick and professional drawing the School and Training plans, School Floor plans, Classroom Layout, Classroom Seating chart, Lecture Room plans of any complexity. Each offered classroom seating chart template is a real help for builders, designers, engineers, constructors, as well as teaching personnel and other teaching-related people in drawing Classroom Seating charts and Training Room layouts with ConceptDraw DIAGRAM classroom seating chart maker.
 Flowcharts
The Flowcharts solution for ConceptDraw DIAGRAM is a comprehensive set of examples and samples in several varied color themes for professionals that need to represent graphically a process. Solution value is added by the basic flow chart template and shapes' libraries of flowchart notation. ConceptDraw DIAGRAM flow chart creator lets one depict the processes of any complexity and length, as well as design the Flowchart either vertically or horizontally.
 AWS Architecture Diagrams
AWS Architecture Diagrams with powerful drawing tools and numerous predesigned Amazon icons and AWS simple icons is the best for creation the AWS Architecture Diagrams, describing the use of Amazon Web Services or Amazon Cloud Services, their application for development and implementation the systems running on the AWS infrastructure. The multifarious samples give you the good understanding of AWS platform, its structure, services, resources and features, wide opportunities, advantages and benefits from their use; solution’s templates are essential and helpful when designing, description and implementing the AWS infrastructure-based systems. Use them in technical documentation, advertising and marketing materials, in specifications, presentation slides, whitepapers, datasheets, posters, etc.
 Health Informatics
Health Informatics solution supplies the ConceptDraw DIAGRAM with tools and functionalities in a field of healthcare design and healthcare informatics. Including collection of professionally designed samples and a lot of high-quality health informatics vector design objects, it is the best for all medical workers and healthcare-related specialties when designing diagrams, schematics, flow charts, workflow charts, block diagrams, infographics, illustrations, and presentations slides in a field of Health Informatics, representing the newest medical information technologies, architectures of healthcare systems, principles of work of the specialized software, structures of health records systems, medical researches processes.
- Class Diagram For Sports Event Management System
- UML Class Diagram
- Class Diagram For Event Management System Pdf
- Object Diagram For Event Management System
- Activity Diagram For Sports Event Management System
- Use Case Diagram Of Online Sports Event Management System
- Sport Shop Management System Project Class Diagram
- Use Case Diagram For Sports Event Management System
- Event Management System Software Project Use Case Swime Lane
- Interfeace Diagram For Sports Event Management System
- Sports Event Management Use Case Diagram
- Sport Event Management System Er Diagram
- Collaboration Diagram Of Sports Event Management System
- Sequence Diagram For Event Management System
- Class Diagram For Sports Management System
- Football | Data Flow Diagrams (DFD) | Ice Hockey | Class Diagram ...
- Collaboration Diagram Of Sports Shop Management System
- Activity Diagram For Event Management System
- Activity Diagram For Sports Management System
- Use Case Diagram For Sports Shop Management
- ERD | Entity Relationship Diagrams, ERD Software for Mac and Win
- Flowchart | Basic Flowchart Symbols and Meaning
- Flowchart | Flowchart Design - Symbols, Shapes, Stencils and Icons
- Flowchart | Flow Chart Symbols
- Electrical | Electrical Drawing - Wiring and Circuits Schematics
- Flowchart | Common Flowchart Symbols
- Flowchart | Common Flowchart Symbols