 Biology
Biology solution extends ConceptDraw DIAGRAM software with samples, templates and libraries containing biological vector symbols, to help you create scientific and educational designs in the field of biology.
How to draw Metro Map style infographics? (Los Angeles)

This is a one-click tool to add stations to the map. It lets you control the direction in which you create new stations, change lengths, and add text labels and icons. It contains Lines, Stations, and Landmarks objects.
How can you illustrate the weather condition

Biology Drawing

ConceptDraw DIAGRAM diagramming and vector drawing software extended with Biology solution from the Science and Education area offers the useful tools for easy biology drawing.
Business People Figures
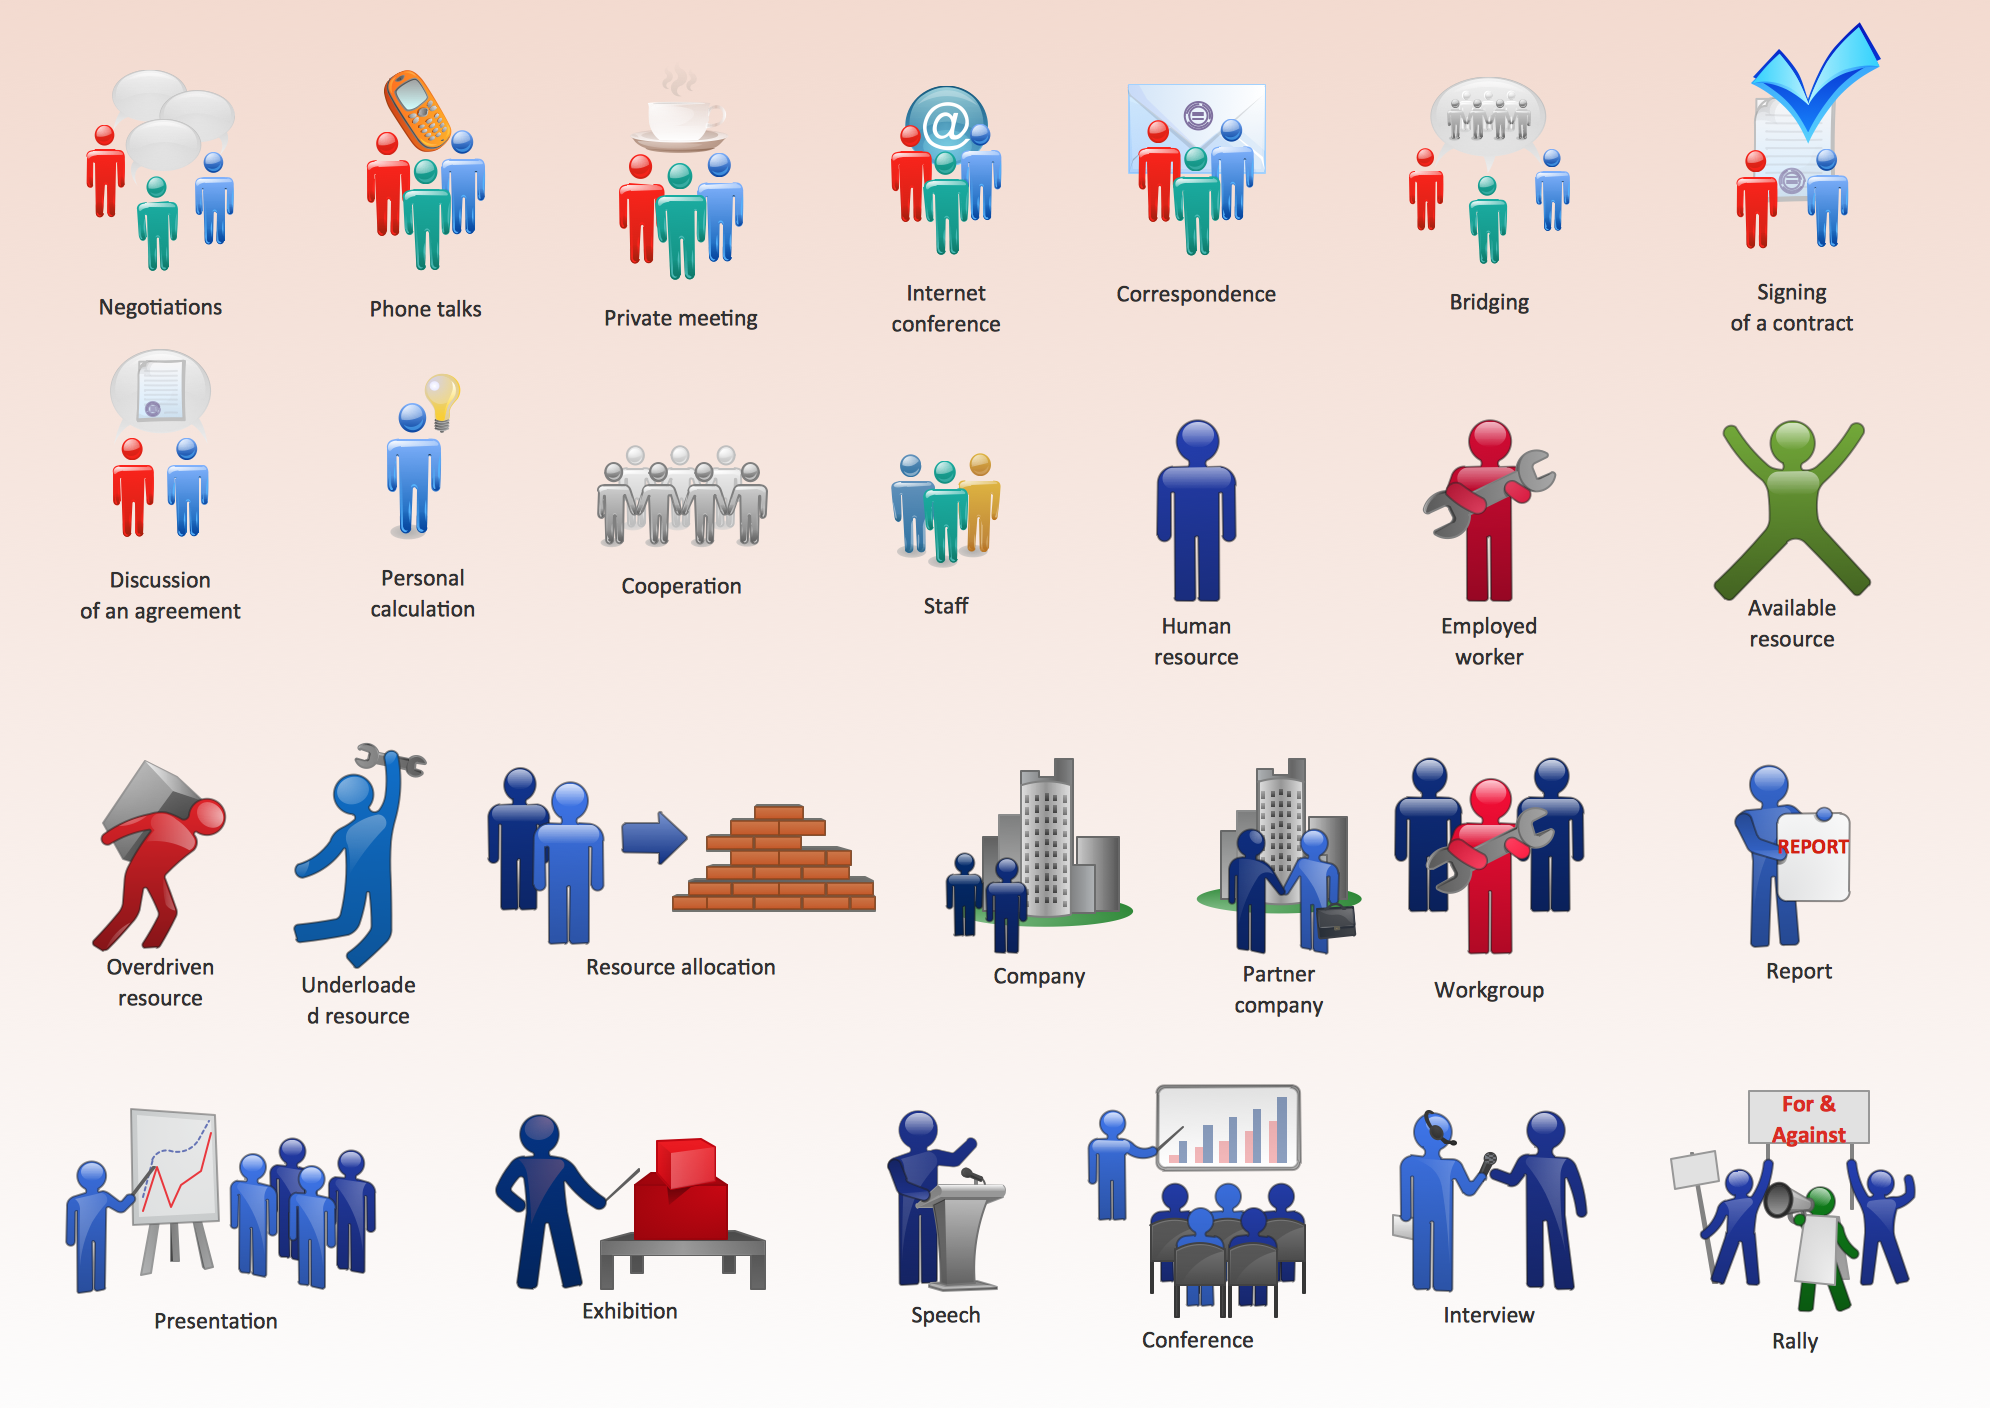
Just check ConceptDraw business perople figusers pictures, you will see all kinds of silhouetes: Staff, Employed workers, Persons and Groups symbols.
Best popular vector pictures are: men, dancing people, business man.
Use human contours wise and it will help you to tell main idea of your design message.
Chemical Engineering

How to Make SWOT Analysis in a Word Document

ConceptDraw products across any platform, meaning you never have to worry about compatibility again. ConceptDraw MINDMAP allows you to make SWOT analysis on PC or macOS operating systems.
"Carbohydrate catabolism is the breakdown of carbohydrates into smaller units. Carbohydrates literally undergo combustion to retrieve the large amounts of energy in their bonds. Energy is secured by mitochondria in the form of ATP.
There are several different types of carbohydrates: polysaccharides (e.g., starch, amylopectin, glycogen, cellulose), monosaccharides (e.g., glucose, galactose, fructose, ribose) and the disaccharides (e.g., maltose, lactose).
Glucose reacts with oxygen in the following redox reaction, C6H12O6 + 6O2 → 6CO2 + 6H2O, the carbon dioxide and water is a waste product and the chemical reaction is exothermic.
The breakdown of glucose into energy in the form of molecules of ATP is therefore one of the most important biochemical pathways found in living organisms." [Carbohydrate catabolism. Wikipedia]
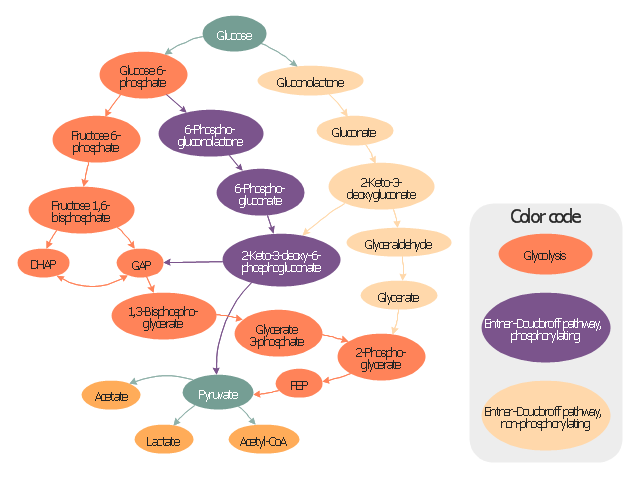
This glucose catabolism pathways map shows glycolysis by orange color, Entner-Doudoroff phosphorylating pathway by green color, Entner-Doudoroff non-phosphorylating pathway by Yellow color.
This methabolic pathway map was redesigned from Wikimedia file: Glucose catabolism pathways.svg. [commons.wikimedia.org/ wiki/ File:Glucose_ catabolism_ pathways.svg]
The biochemical diagram example "Glucose catabolism pathways map" was created using the ConceptDraw PRO diagramming and vector drawing software extended with the Biology solution from the Science and Education area of ConceptDraw Solution Park.
There are several different types of carbohydrates: polysaccharides (e.g., starch, amylopectin, glycogen, cellulose), monosaccharides (e.g., glucose, galactose, fructose, ribose) and the disaccharides (e.g., maltose, lactose).
Glucose reacts with oxygen in the following redox reaction, C6H12O6 + 6O2 → 6CO2 + 6H2O, the carbon dioxide and water is a waste product and the chemical reaction is exothermic.
The breakdown of glucose into energy in the form of molecules of ATP is therefore one of the most important biochemical pathways found in living organisms." [Carbohydrate catabolism. Wikipedia]
This glucose catabolism pathways map shows glycolysis by orange color, Entner-Doudoroff phosphorylating pathway by green color, Entner-Doudoroff non-phosphorylating pathway by Yellow color.
This methabolic pathway map was redesigned from Wikimedia file: Glucose catabolism pathways.svg. [commons.wikimedia.org/ wiki/ File:Glucose_ catabolism_ pathways.svg]
The biochemical diagram example "Glucose catabolism pathways map" was created using the ConceptDraw PRO diagramming and vector drawing software extended with the Biology solution from the Science and Education area of ConceptDraw Solution Park.
Catabolic pathway map
Business Diagram Software


HelpDesk
How to a Draw Biology Diagram

- Concept Map Of Krebs Cycle With Explanation
- Design elements - TCA cycle | Biology | Biology Drawing | Draw The ...
- Metabolic pathway map - Biochemical diagram | Concept Map ...
- Flow Map | Citric acid cycle ( TCA cycle ) | Value stream map example ...
- Citric acid cycle ( TCA cycle ) | Design elements - TCA cycle | Biology ...
- Carbohydrates Concept Map
- Biology | Biology Drawing | Biology Illustration | Glycolysis Pathways ...
- Biology | Biology Drawing | Biology Illustration | Mind Map ...
- Carbohydrate Metabolism In Mond Map Concept
- Catabolism schematic - Biochemical diagram | Health Food ...
- ERD | Entity Relationship Diagrams, ERD Software for Mac and Win
- Flowchart | Basic Flowchart Symbols and Meaning
- Flowchart | Flowchart Design - Symbols, Shapes, Stencils and Icons
- Flowchart | Flow Chart Symbols
- Electrical | Electrical Drawing - Wiring and Circuits Schematics
- Flowchart | Common Flowchart Symbols
- Flowchart | Common Flowchart Symbols