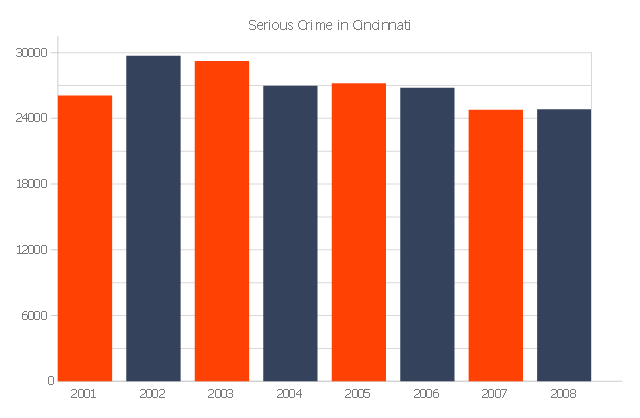
The bar graph example "Serious Crime in Cincinnati" was redesigned from the Commons Wikimedia file: Cincinnati-Part-1-Crimes.jpg.
[commons.wikimedia.org/ wiki/ File:Cincinnati-Part-1-Crimes.jpg]
"Before the riot of 2001, Cincinnati's overall crime rate was dropping dramatically and had reached its lowest point since 1992. After the riot violent crime increased. Reflecting national trends, crime rates in Cincinnati have dropped in all categories from 2006 to 2010." [Crime in Cincinnati. Wikipedia]
The bar graph example "Serious Crime in Cincinnati" was created using the ConceptDraw PRO diagramming and vector drawing software extended with the Bar Graphs solution from the Graphs and Charts area of ConceptDraw Solution Park.
www.conceptdraw.com/ solution-park/ charts-bar-graphs
Column graph
How to Create a Column Chart

Column Chart Template

Chart Examples

- Bar graph - Serious Crime in Cincinnati | Chart Examples | Column ...
- Column Chart Examples
- Polar Graph | Step Area Graph | Picture graph template |
- Picture Graphs | Line Graphs | Create Graphs and Charts |
- Bar Chart Examples | Bar Chart Software | Bar Graphs |
- Bar Chart Software | Bar Chart Examples | How to Create a Bar Chart |
- Bar Chart Examples - Conceptdraw.com
- Chart Examples | Line Chart Examples | Bar Chart Examples |
- Bar Chart Examples
- Bar Graphs | Bar Chart Examples | Bar Chart Software |
- Sales Growth. Bar Graphs Example - Conceptdraw.com
- How to Create a Column Chart | Bar Chart Software | Column Chart ...
- Column Chart Software | How to Create a Column Chart | Bar Chart ...
- Column Chart Software
- How to Create a Pie Chart | How to Create a Column Chart ...
- Entity-Relationship Diagram (ERD) | Pyramid Diagrams | Types of ...
- Horizontal Orgchart | ConceptDraw PRO - Organizational chart ...
- How to Draw an Organization Chart | Organizational Structure ...
- Column Chart Examples - Conceptdraw.com
- Cross-Functional Flowchart
- ERD | Entity Relationship Diagrams, ERD Software for Mac and Win
- Flowchart | Basic Flowchart Symbols and Meaning
- Flowchart | Flowchart Design - Symbols, Shapes, Stencils and Icons
- Flowchart | Flow Chart Symbols
- Electrical | Electrical Drawing - Wiring and Circuits Schematics
- Flowchart | Common Flowchart Symbols
- Flowchart | Common Flowchart Symbols