 Bar Graphs
The Bar Graphs solution enhances ConceptDraw PRO v10 functionality with templates, numerous professional-looking samples, and a library of vector stencils for drawing different types of Bar Graphs, such as Simple Bar Graph, Double Bar Graph, Divided Bar Graph, Horizontal Bar Graph, Vertical Bar Graph, and Column Bar Chart.
Sales Growth. Bar Graphs Example

Bar Chart Software

Bar Chart Examples

Bar Graph

Financial Comparison Chart

 Divided Bar Diagrams
The Divided Bar Diagrams Solution extends the capabilities of ConceptDraw PRO v10 with templates, samples, and a library of vector stencils for drawing high impact and professional Divided Bar Diagrams and Graphs, Bar Diagram Math, and Stacked Graph.
Bar Diagrams for Problem Solving. Create economics and financial bar charts with Bar Graphs Solution

Chart Maker for Presentations

Bar Diagrams for Problem Solving. Create business management bar charts with Bar Graphs Solution

Chart Software for Better Presentations

Graphs and Charts Area provide a wide collection of professional looking predesigned templates, samples and ready-to-use vector stencils that will help you to draw the charts and diagrams of various types: Pie Charts, Donut Charts, Line Charts, Column Charts, Bar Charts, Pyramids, Scatter Charts, Venn Diagrams, Spider Charts, Area Charts, Divided Bar Graphs.
Bar Chart

Bar Diagrams for Problem Solving. Create event management bar charts with Bar Graphs Solution

 Picture Graphs
Typically, a Picture Graph has very broad usage. They many times used successfully in marketing, management, and manufacturing. The Picture Graphs Solution extends the capabilities of ConceptDraw PRO v10 with templates, samples, and a library of professionally developed vector stencils for designing Picture Graphs.
Column Chart Software

Bar Diagrams for Problem Solving. Create space science bar charts with Bar Graphs Solution

Create bar graphs for visual solving your scientific problems and data comparison using the ConceptDraw PRO diagramming and vector drawing software extended with the Bar Graphs Solution from the Graphs and Charts area of ConceptDraw Solition Park.
Bar Charts

Bar Diagrams for Problem Solving. Create manufacturing and economics bar charts with Bar Graphs Solution

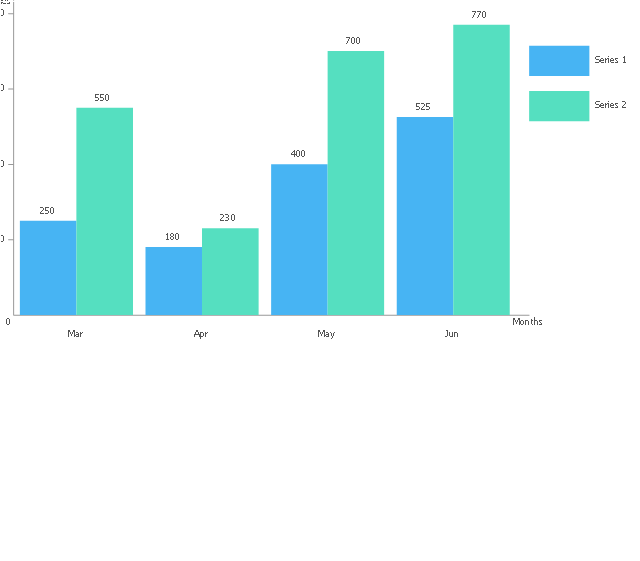
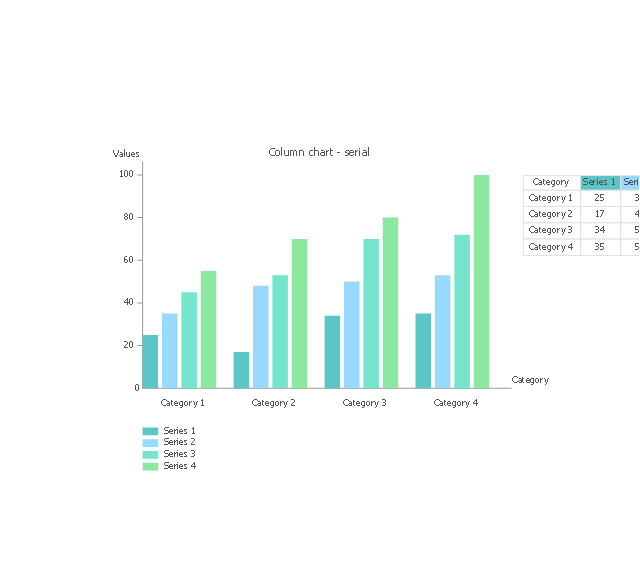
The vector stencils library "Bar charts" contains 6 templates of bar and column charts for visualizing quantitative and statistical data comparison and changes in time series. Use these shapes to draw your bar graphs in the ConceptDraw PRO diagramming and vector drawing software extended with the Bar Graphs solution from the Graphs and Charts area of ConceptDraw Solution Park.
Vertical bar chart

Horizontal bar chart

Double bar chart
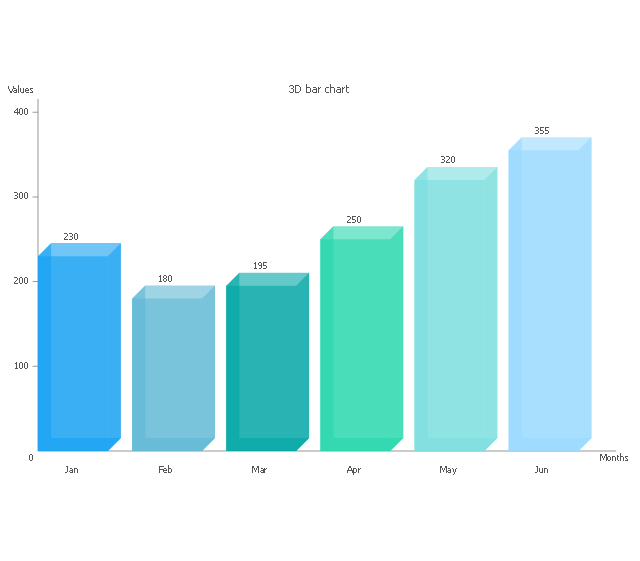
3D bar chart
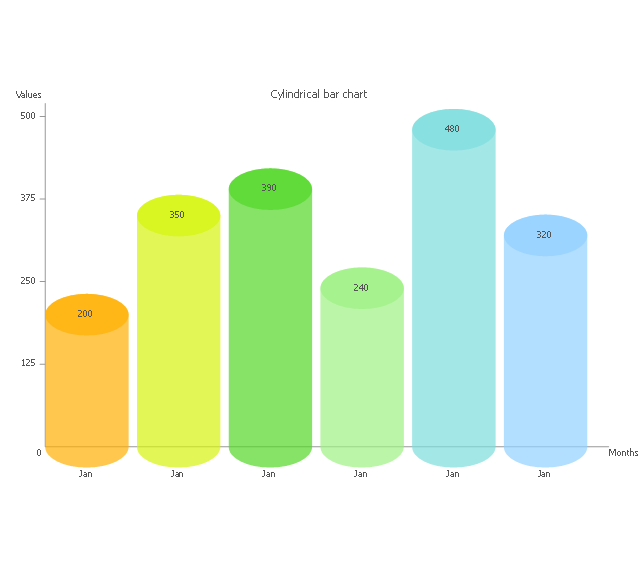
Cylindrical bar chart
Coordinate system 3D
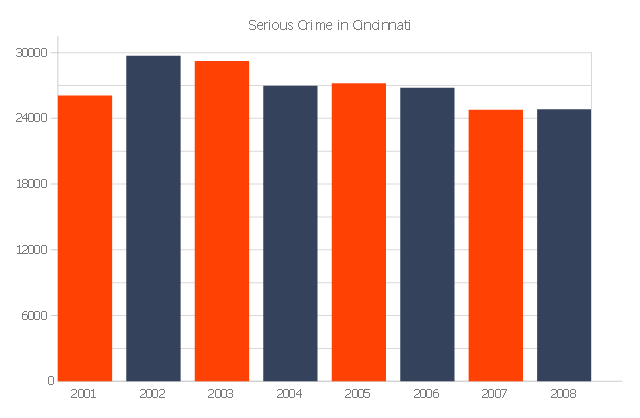
The bar graph example "Serious Crime in Cincinnati" was redesigned from the Commons Wikimedia file: Cincinnati-Part-1-Crimes.jpg.
[commons.wikimedia.org/ wiki/ File:Cincinnati-Part-1-Crimes.jpg]
"Before the riot of 2001, Cincinnati's overall crime rate was dropping dramatically and had reached its lowest point since 1992. After the riot violent crime increased. Reflecting national trends, crime rates in Cincinnati have dropped in all categories from 2006 to 2010." [Crime in Cincinnati. Wikipedia]
The bar graph example "Serious Crime in Cincinnati" was created using the ConceptDraw PRO diagramming and vector drawing software extended with the Bar Graphs solution from the Graphs and Charts area of ConceptDraw Solution Park.
www.conceptdraw.com/ solution-park/ charts-bar-graphs
Column graph
- Sales Growth. Bar Graphs Example | Financial Comparison Chart ...
- Bar Chart Examples | Sales Growth. Bar Graphs Example | Bar ...
- Double Bar Graph | Create Graphs and Charts | Design elements ...
- Picture Graphs | Line Graphs | Bar Graphs | Graphs
- Sales Growth. Bar Graphs Example | Bar Graphs | Sales Dashboard ...
- Bar Chart Examples | Column Chart Examples | Bar Graphs
- Bar Graphs | Bar Chart Examples | Bar Chart Software | Bar Graph
- Bar Chart Examples | Bar Chart Software | Bar Graphs | Bar Graph ...
- Bar Chart Software | Bar Chart Examples | Bar Graphs | Bar Graph
- Sales Growth. Bar Graphs Example | Business Report Pie. Pie Chart ...
- Financial Comparison Chart | Sales Growth. Bar Graphs Example ...
- Double Bar Graph | Chart Maker for Presentations | Picture Graphs ...
- Double bar graph template | Bar Chart Software | Column Chart ...
- Bar Graphs | Bar Chart Examples | Sales Growth. Bar Graphs
- Graphs and Charts Area | Bar Graphs | Picture Graphs | Charts Graphs
- Sales Growth. Bar Graphs Example | Create Graphs and Charts ...
- Bar Chart Examples
- Marketing | Line Graphs | Bar Graphs | Swot Graph
- Bar Chart Software | Sales Growth. Bar Graphs Example | Column ...
- Bar Chart Examples | Bar Chart Software | Bar Graphs | Simple Bar ...
- ERD | Entity Relationship Diagrams, ERD Software for Mac and Win
- Flowchart | Basic Flowchart Symbols and Meaning
- Flowchart | Flowchart Design - Symbols, Shapes, Stencils and Icons
- Flowchart | Flow Chart Symbols
- Electrical | Electrical Drawing - Wiring and Circuits Schematics
- Flowchart | Common Flowchart Symbols
- Flowchart | Common Flowchart Symbols