Basic Diagramming
Perfect charts and graphics diagramming software with rich examples and template. ConceptDraw is ideal to draw Charts and Graphics.
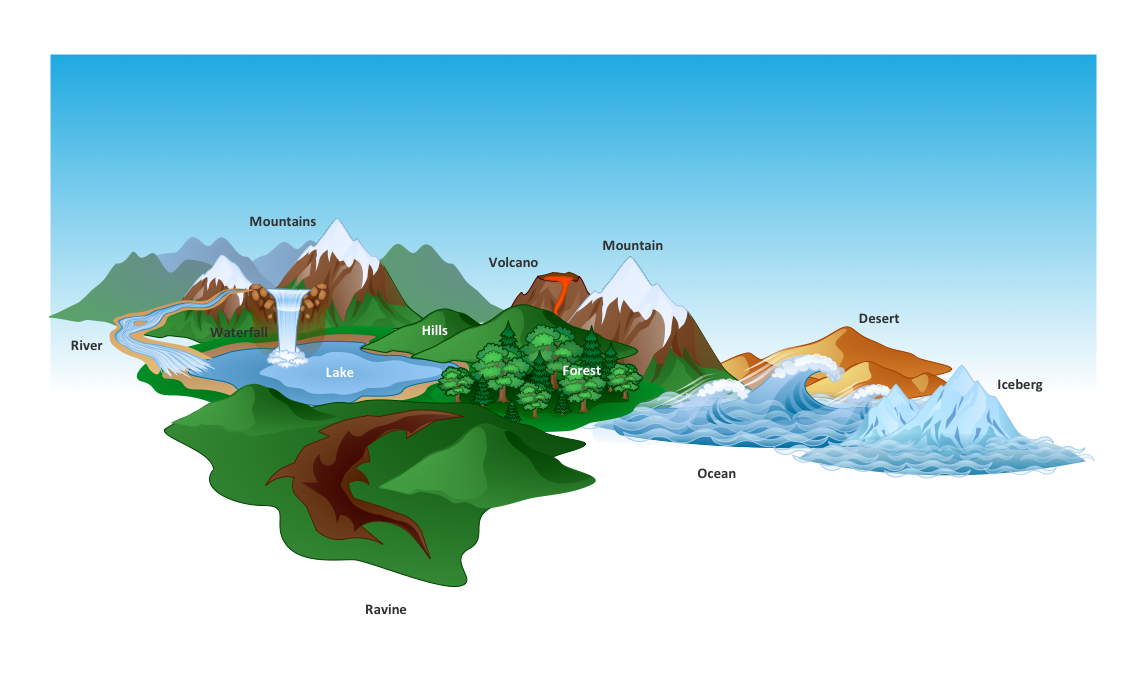
Beautiful Nature Scene: Drawing
The Nature Solution addition to ConceptDraw Solution Park for ConceptDraw PRO includes new libraries that provide a wide range nature objects and it can be used to augment documentation and graphics. Draw beautiful nature scenes using ConceptDraw PRO software with Nature solution.Horizontal Flowchart
This sample was created in ConceptDraw PRO diagramming and vector drawing software using the Flowcharts solution from the Diagrams area of ConceptDraw Solution Park.A Flowchart is a graphically representation of the process, algorithm or the step-by-step solution of the problem. The Flowcharts have one or more starting and ending points. The geometric figures on the Flowcharts represent the steps of the process and are connected with arrows that show the sequence of the actions.
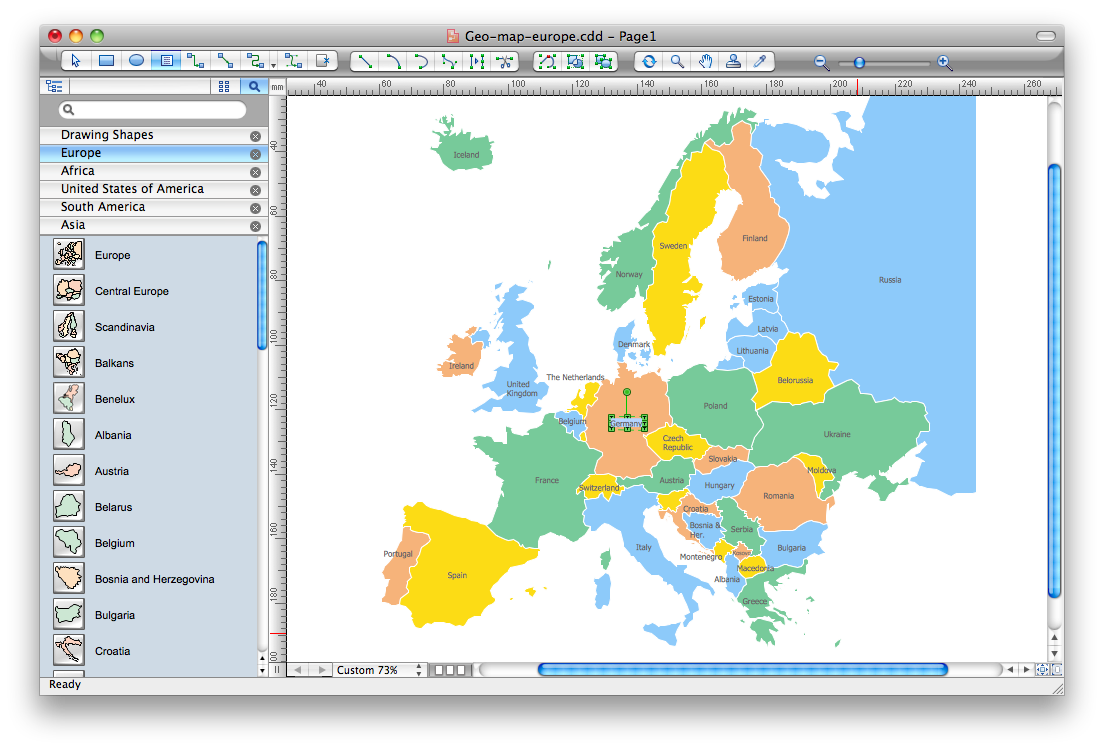
Map Software
Create maps, flags, and more with ConceptDrawCross-Functional Flowchart
Cross-Functional Flowchart - to draw cross functional process maps is by starting with a cross-functional flowchart samples and templates. Easy to draw sample cross functional Process Flow Diagrams. Using a Cross-Functional flowchart is a clear way of showing each team member’s responsibilities and how processes get shared or transferred between different teams and departments.Use cross-functional flowcharts to show the relationship between a business process and the functional units (such as departments) responsible for that process. To create it use the best flowchart maker of ConceptDraw PRO.

Scatter Graph Charting Software
ConceptDraw provides some interactive xy chart and scatter graph symbols that offers advanced features yet is simple to use.Create Graphs and Charts
Charting Software allows you to create diagrams, charts, graphs, flowcharts, and other business graphics. ConceptDraw PRO include simple shape drawing tools, examples, templates, and symbol libraries.ConceptDraw Arrows10 Technology
Connecting objects manually in ConceptDraw PRO is a snap:- points;
- Connecting groups of objects;
- Auto-routing;
- Connectors text;
- Snap to Guides ;
- Quick.
Basic Network Diagram
A perfect tool to draw basic computer network diagrams, designs, schematics, and network maps. Numerous stencils and templates.
Organizational Charts with ConceptDraw PRO
With ConceptDraw PRO, you can quickly and easily create any type of orgchart professional. ConceptDraw PRO includes numerous organizational chart templates for the simple to complex multi-page charts.
 ConceptDraw Solution Park
ConceptDraw Solution Park collects graphic extensions, examples and learning materials
Cross-Functional Flowchart (Swim Lanes)
ConceptDraw PRO diagramming software provides vector shapes and connector tools for quick and easy drawing diagrams for business, technology, science and education.Use flowchart maker of ConceptDraw PRO enhanced with solutions from ConceptDraw Solution Park to create diagrams to present and explain structures, process flows, logical relationships, networks, design schemes and other visually organized information and knowledge.
Onion Diagram Maker
The onion diagram is a type of diagram which shows the dependencies among parts of an organization or process. The items are displayed at the concentric circles, where the items at the bigger rings depend on the items at the smaller rings.ConceptDraw PRO diagramming and vector drawing software extended with Stakeholder Onion Diagrams Solution from the Management Area of ConceptDraw Solution Park is a professional Onion Diagram Maker.
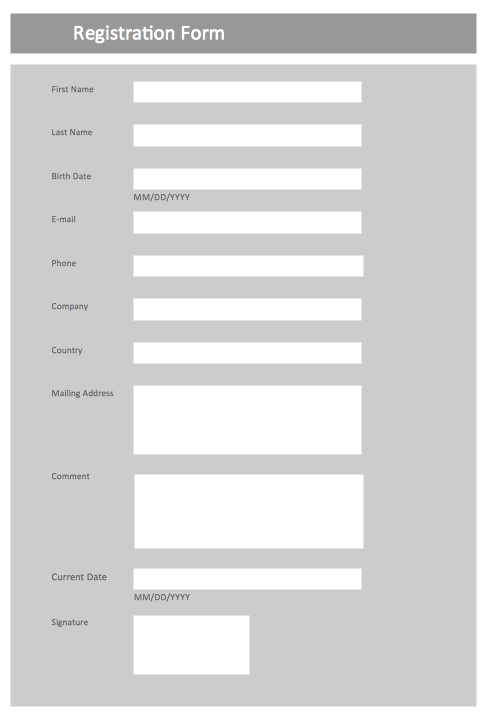
Form Maker
Use the Basic Diagramming Solution from the Universal Diagramming area of ConceptDraw Solution Park to easy create simple forms, questionnaires, survey forms, registration and application forms, etc.Bar Diagrams for Problem Solving. Create space science bar charts with Bar Graphs Solution
Bar charts represent data in different categories or groups.Create bar graphs for visual solving your scientific problems and data comparison using the ConceptDraw PRO diagramming and vector drawing software extended with the Bar Graphs Solution from the Graphs and Charts area of ConceptDraw Solition Park.
- About Nature Simple Diagram
- How To Draw Beautiful Drawing Chart
- Nature | Beauty in nature Illustrations and Clipart | Drawing ...
- Beautiful Nature Scene: Drawing | How can you illustrate the ...
- Basic Diagramming | Drawing Illustration | Beautiful Nature Scene ...
- Drawing Natural Diagram
- Basic Diagramming | Beautiful Nature Scene: Drawing | Basic ...
- Drawing Illustration | Drawing a Nature Scene | Circular Arrows ...
- Basic Diagramming | Emergency Plan | Simple Scene Drawing
- Drawing Chart Of Nature
- Beautiful Nature Scene: Drawing | Beauty in nature Illustrations and ...
- Basic Diagramming | Simple Nature Scene
- Natures Pics That Can Draw In Chart
- Drawing Illustration | Drawing a Nature Scene | Draw Flowcharts ...
- Pie Charts | ConceptDraw Solution Park | Bar Graphs | Pie Chart On ...
- Nature Drawing Charts
- Simple Hydrological Cycle Flow Chart
- Drawing Illustration | Drawing a Nature Scene | Draw Flowcharts ...
- The most spoken languages of the world | Bar Chart Software | Bar ...
- The Nature Of A Divided Bar Graph
- ERD | Entity Relationship Diagrams, ERD Software for Mac and Win
- Flowchart | Basic Flowchart Symbols and Meaning
- Flowchart | Flowchart Design - Symbols, Shapes, Stencils and Icons
- Flowchart | Flow Chart Symbols
- Electrical | Electrical Drawing - Wiring and Circuits Schematics
- Flowchart | Common Flowchart Symbols
- Flowchart | Common Flowchart Symbols


