Simple Flow Chart
ConceptDraw DIAGRAM diagramming and vector drawing software extended with Flowcharts Solution from the 'Diagrams' area of ConceptDraw Solution Park is a powerful tool for drawing Flow Charts of any complexity you need. Irrespective of whether you want to draw a Simple Flow Chart or large complex Flow Diagram, you estimate to do it without efforts thanks to the extensive drawing tools of Flowcharts solution, there are professional flowchart symbols and basic flowchart symbols. This sample shows the Gravitational Search Algorithm (GSA) that is the optimization algorithm.What is a Cross Functional Flow Chart?
For those who want to know what is a cross functional flowchart and how to draw it, we preared a special library and professional looking templates.Take all the advantage of your drawing software to learn and create such a well-designed flowcharts.
Watch the HowTo video to learn more.
Process Flow Diagrams
A process flow diagram (PFD) is a diagram commonly used in chemical and process engineering to indicate the general flow of plant processes and equipment.ConceptDraw DIAGRAM diagramming and vector drawing software extended with Flowcharts Solution from the "Diagrams" Area of ConceptDraw Solution Park offers the extensive drawing tools for quick and easy design professional looking Process Flow Diagrams.
Flow Chart Symbols
ConceptDraw DIAGRAM software extended with Flowcharts Solution from the "Diagrams" Area is a powerful software that will help you design the flowcharts for any business and technical processes, and software algorithms thanks to the predesigned flow chart symbols. Flowcharts solution offers 2 libraries with large collection of vector flow chart symbols: Flowchart Library, Flowcharts Rapid Draw Library that you can use to create your flowcharts quick and easy. Flowchart Solution is number of diagraming stencils including special set of flow chart symbols such as: terminator, process, decision which indicates a decision points between two or more paths in a flowchart, symbol of delay. Major symbols includes symbol of data, document or multiple documents, subroutine, preparation for processing of documents. Also includes symbols: display, manual input, manual loop, loop limit, stored data,connectors and suming junctions, sort and merge operations, symbols of database and internal storSocial Media Response Management DFD Charts - software tools
ConceptDraw is your tool for driving social integration and managing change across and streamline social media processes of your organisation.This tool keeps the entire team on the same page allowing you to realize your social media strategy, improve the quality of your answers, and minimize the time it takes to respond.
Spatial infographics Design Elements: Transport Map
Do you like infographics and data visualization? Creating infographics is super-easy with ConceptDraw.Basic Audit Flowchart. Flowchart Examples
This sample shows the Audit Process Flowchart. It was created in ConceptDraw DIAGRAM diagramming and vector drawing software using the Flowcharts solution from the Diagrams area of ConceptDraw Solution Park.The Audit Flowcharts are widely used in the financial management, accounting, money management and in many others fields.
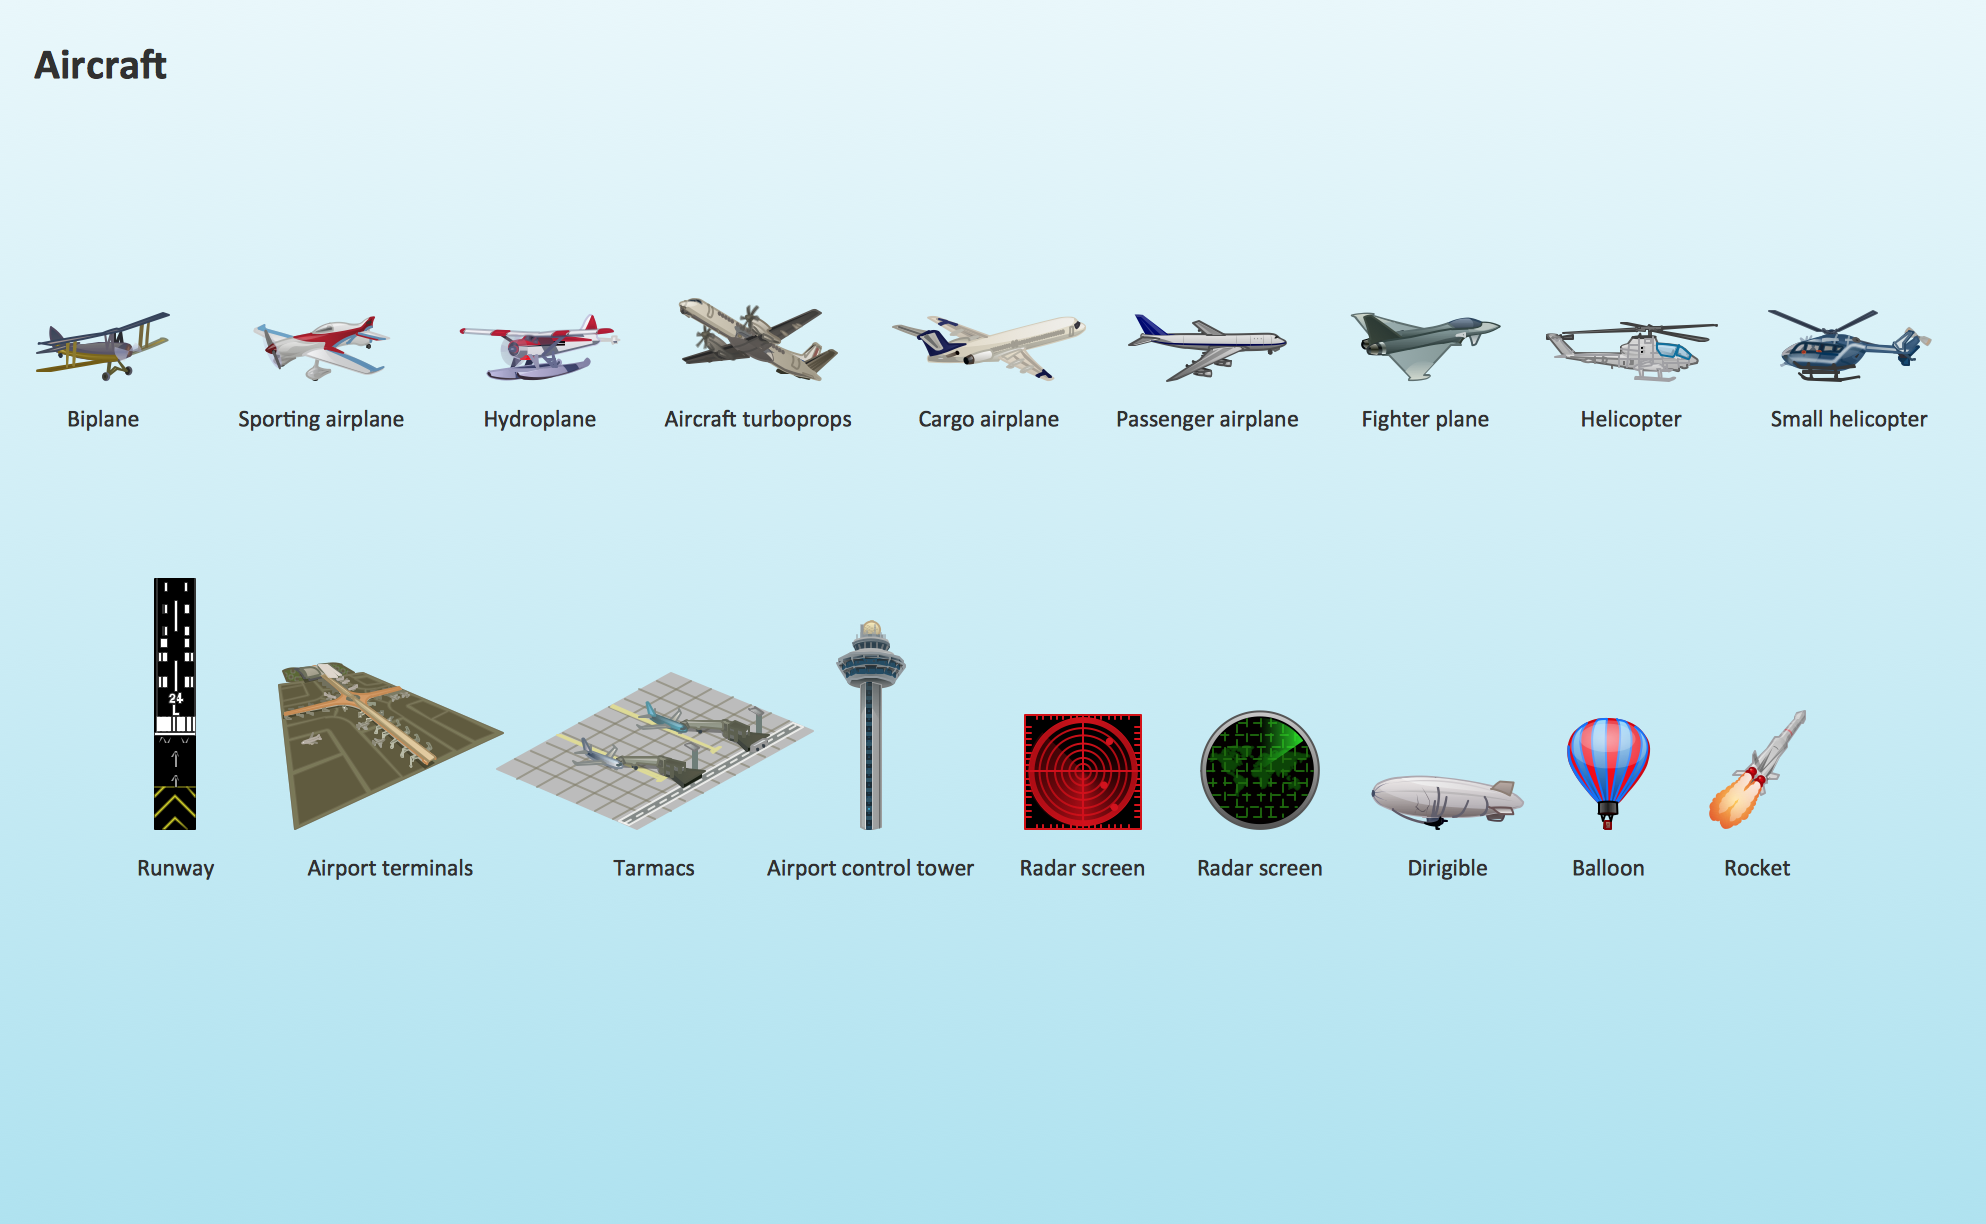
Aircraft - Design Elements
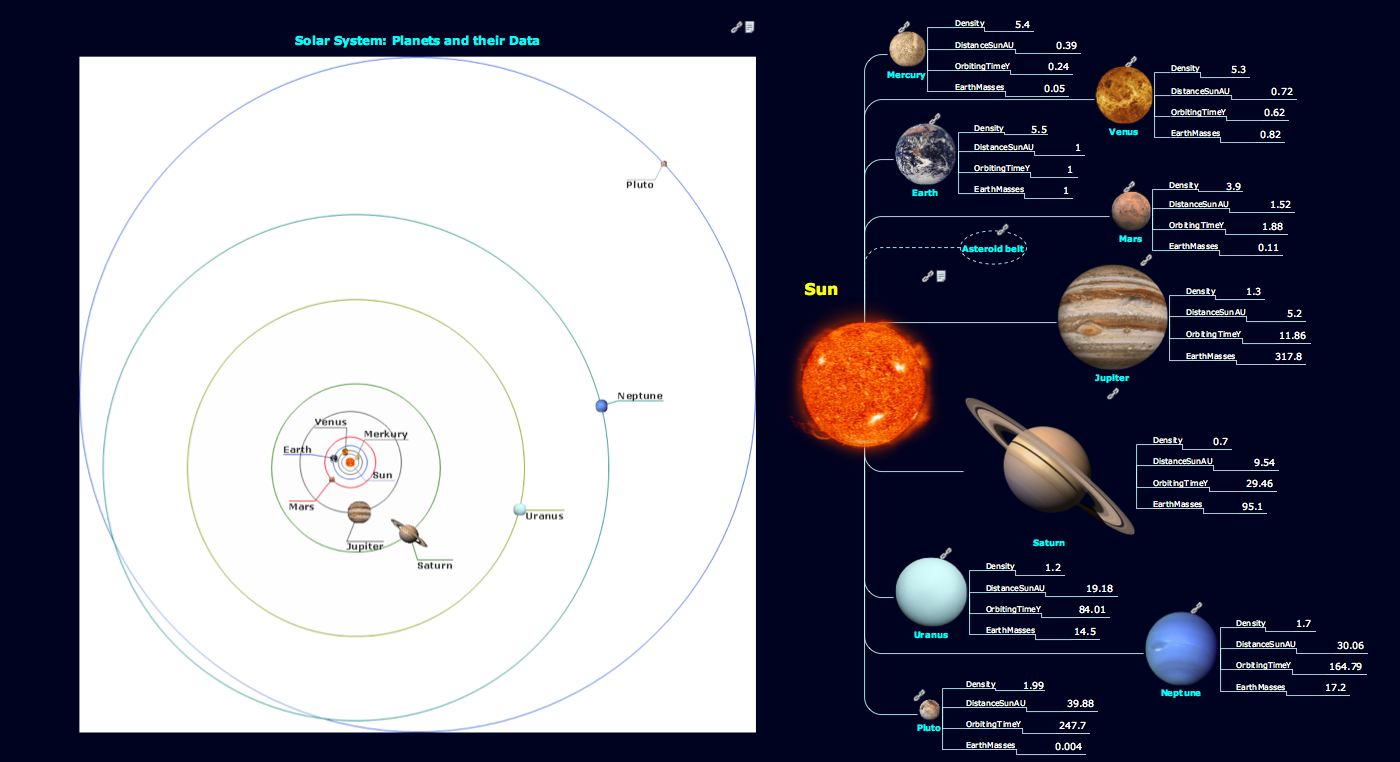
The vector stencils library Aircraft contains clipart of aerospace objects, transportation vehicles, office buildings, and ancillary facilities for ConceptDraw DIAGRAM diagramming and vector drawing software.Sun Solar System
ConceptDraw DIAGRAM diagramming and vector drawing software offers the Astronomy solution with useful tools for drawing all kinds of astronomy pictures and sun solar system illustrations.The astronomy illustrations designed with ConceptDraw DIAGRAM are vector graphic documents and are available for reviewing, modifying, converting to a variety of formats (image, HTML, PDF file, MS PowerPoint Presentation, Adobe Flash or MS Visio XML), printing and send via e-mail in one moment.
Pictorial Chart
You want design Pictorial Chart or Infographic? And you need powerful infographic software? Then ConceptDraw DIAGRAM diagramming and vector drawing software extended with Pictorial Infographics Solution from the “Infographics” Area is exactly what you need.Circular Flow Diagram Template
You need to draw the Circular Arrows Diagram, Segmented Diagram or Circular Flow Diagram? Any of these diagrams can be fast and easy designed in ConceptDraw DIAGRAM.ConceptDraw DIAGRAM diagramming and vector drawing software offers the Circular Arrows Diagrams Solution from the "Diagrams" Area with extensive drawing tools, predesigned samples and circular flow diagram template. Use of ready template is the easiest way of drawing.How to Simplify Flow Charting — Cross-functional Flowchart
In ConceptDraw DIAGRAM it really is sp simple to draw even the most complex cross-functional flowcharts. Use the RapidDraw technology and Cross-Functional libraries in ConceptDraw DIAGRAM for the best results.Internal Audit Process
Internal auditing is an independent, objective assurance and consulting activity designed to add value and improve an organization's operations.ConceptDraw DIAGRAM diagramming and vector drawing software extended with Audit Flowcharts solution from the Finance and Accounting area perfectly suits for the Internal Audit Process. You can make sure this right now!
SDL Flowchart Symbols
Drawing the diagrams we try to find in help the powerful software and now we have the ConceptDraw DIAGRAM. The ability easily create the SDL diagrams is made possible thanks to unique Specification and Description Language (SDL) Solution from the Industrial Engineering Area of ConceptDraw Solution Park. This solution extends ConceptDraw DIAGRAM 2 libraries - SDL Connectors and SDL Diagrams that contain 70 predesigned SDL flowchart symbols.Swim Lane Diagrams
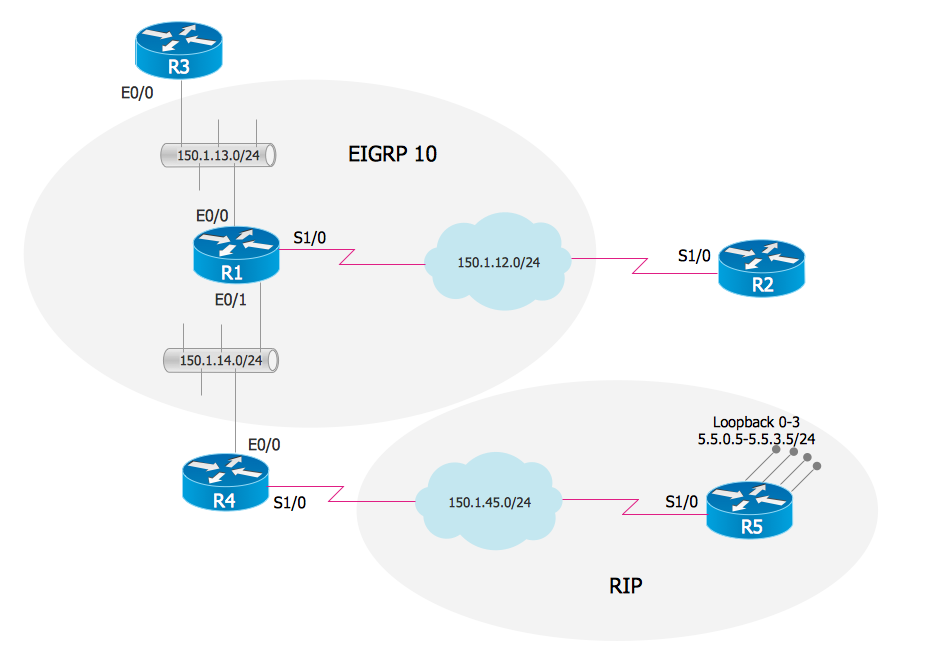
Swim Lane diagrams are the variety of process flow diagrams and are based on the IDEF3 standard. They were developed by Lynn Shostack for usage in projecting. With their help organization diagrams are combined with process flow, as they visually display an object of the production system which is charged with given concrete processes in general flow of processes of the production system.EIGRP. Computer and Network Examples
The Enhanced Interior Gateway Routing Protocol (EIGRP) is a progressive distance-vector dynamic routing protocol. It was developed by the Cisco Systems and is available as an open standard from 2013.EIGRP is used to help automate routing decisions and configuration of the computer network. It allows the routers of the same logical area automatically share route information.

Pyramid Diagram
A four level pyramid model of different types of Information Systems based on the different levels of hierarchy in an organization.How to Draw a Flowchart
Are you confused on how to draw a flow chart? Here are some guidelines which can be used to ease the process of understanding the system and its flow.Although there are many symbols that can be used in flowcharts to represent different kinds of steps, accurate flowcharts can be created using very few (e.g. Process, Decision, Start, delay, cloud).
Improving Problem Solving and Focus with Fishbone Diagrams
When you need to focus on the problem, professional diagramming tool helps you create a Fishbone diagram also known as Ishikawa diagram. Understanding of the problem via Fishbone diagram will improve the processes between departments and teams.ConceptDraw DIAGRAM extended with Fishbone Diagrams solution gives a powerful tool for improving problem solving and focus with Fishbone diagrams.
- Simple Flow Chart | Chart On Gravitational Force
- Simple Flow Chart | Flow Chat Of Gravitation
- Simple Flow Chart | Basic Audit Flowchart. Flowchart Examples ...
- Site Edu Flowchart On Gravitation
- Gravity filtration of liquids | Diagram Of Gravity Filtration Techniques
- Simple Flow Chart | | Sales Process Flowchart Symbols | Force Flow ...
- Gravitational Force Charts
- Simple Flow Chart | | Sales Process Flowchart Symbols | Flow Chart ...
- Simple Flow Chart | Chemistry Symbols and Meanings | Chemistry ...
- Simple Flow Chart | How to Draw Physics Diagrams in ConceptDraw ...
- Simple Flow Chart | | Sales Process Flowchart Symbols | Force Flow ...
- Simple Flow Chart | Chemistry | Physics | Diagram Of Gravity
- Simple Flow Chart | Sales Process Flowchart Symbols | | Flowchart ...
- Simple Flow Chart | Chemistry | Physics | Flowchart On Gravity
- Simple Flow Chart | | Sales Process Flowchart Symbols | How To ...
- Simple Flow Chart | | Sales Process Flowchart Symbols | Make A ...
- How to Draw Physics Diagrams in ConceptDraw PRO | Block ...
- Logistics Flow Charts | Simple Flow Chart | Flowchart Components ...
- Transportation Management System Flow Chart
- Flowchart Components | Transportation Infographics | Flow chart ...
- ERD | Entity Relationship Diagrams, ERD Software for Mac and Win
- Flowchart | Basic Flowchart Symbols and Meaning
- Flowchart | Flowchart Design - Symbols, Shapes, Stencils and Icons
- Flowchart | Flow Chart Symbols
- Electrical | Electrical Drawing - Wiring and Circuits Schematics
- Flowchart | Common Flowchart Symbols
- Flowchart | Common Flowchart Symbols


