Competitor Analysis

Simple Drawing Applications for Mac

Business Productivity - Marketing

intelligent vector graphics that are useful for marketing diagramming and
ConceptDraw MINDMAP for key marketing mind maps.
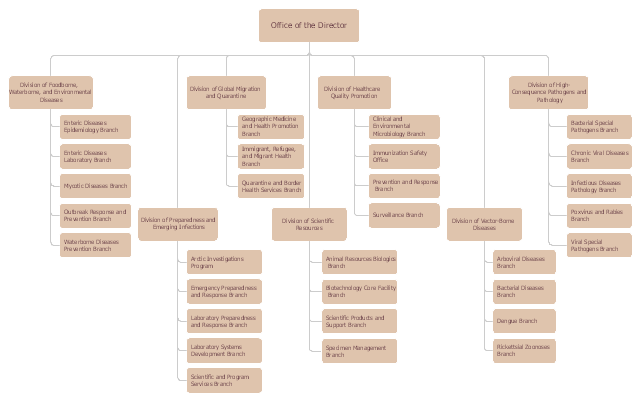
This example is based on the organizational chart from the NCEZID website. [cdc.gov/ ncezid/ org-ncezid.html]
"The National Center for Emerging and Zoonotic Infectious Diseases aims to prevent disease, disability, and death caused by a wide range of infectious diseases. We focus on diseases that have been around for many years, emerging diseases (those that are new or just recently identified), and zoonotic diseases (those spread from animals to people). Our work is guided in part by a holistic "One Health" strategy, which recognizes the vital interconnectedness of microbes and the environment. Through a comprehensive approach involving many scientific disciplines, we can attain better health for humans and animals and improve our environment.
To carry out our mission, we use many different tactics: providing leadership in public health, conducting exemplary science, strengthening preparedness efforts, establishing public health policy, sharing vital health information with the public, and building partnerships. Each of the center’s seven divisions works with partners to protect and improve the public’s health in the United States and worldwide." [cdc.gov/ ncezid/ ]
The organizational chart example "National Center for Emerging and Zoonotic Infectious Diseases" was created using the ConceptDraw PRO diagramming and vector drawing software extended with the Organizational Charts solution from the Management area of ConceptDraw Solution Park.
Organizational chart - National Center for Emerging and Zoonotic Infectious Diseases
Good Flow Chart app for Mac

Human Resource Development

ConceptDraw DIAGRAM diagramming and vector drawing software supplied with HR Flowcharts Solution from the Management Area of ConceptDraw Solution Park can effectively help in labour-intensive process of human resource development.
Matrix Organization Structure

Now we have ConceptDraw DIAGRAM diagramming and vector drawing software extended with 25 Typical Orgcharts solution from the Management area of ConceptDraw Solution Park which will help easy represent matrix organizational structure of any degree of complexity.
"Project planning is part of project management, which relates to the use of schedules such as Gantt charts to plan and subsequently report progress within the project environment.
Initially, the project scope is defined and the appropriate methods for completing the project are determined. Following this step, the durations for the various tasks necessary to complete the work are listed and grouped into a work breakdown structure. Project planning is often used to organize different areas of a project, including project plans, work loads and the management of teams and individuals. The logical dependencies between tasks are defined using an activity network diagram that enables identification of the critical path. Float or slack time in the schedule can be calculated using project management software. Then the necessary resources can be estimated and costs for each activity can be allocated to each resource, giving the total project cost. At this stage, the project schedule may be optimized to achieve the appropriate balance between resource usage and project duration to comply with the project objectives. Once established and agreed, the project schedule becomes what is known as the baseline schedule. Progress will be measured against the baseline schedule throughout the life of the project. Analyzing progress compared to the baseline schedule is known as earned value management.
The inputs of the project planning phase include the project charter and the concept proposal. The outputs of the project planning phase include the project requirements, the project schedule, and the project management plan." [Project planning. Wikipedia]
The flow chart example "Project planning process" was created using the ConceptDraw PRO diagramming and vector drawing software extended with the Flowcharts solution from the area "What is a Diagram" of ConceptDraw Solution Park.
Flowchart - Project planning process

This example is based on the organizational chart from the Ohio State University website. [osu.edu/ vpsearch/ images/ University_ Org_ Chart.png]
"The Ohio State University, a multi-campus land grant institution with an international presence, is a world-class public research university and the leading comprehensive teaching and research institution in the state, Ohio's flagship university. Ohio State provides a distinctive educational experience for students and pursues cutting-edge interdisciplinary research that brings together scholars from diverse disciplines to solve key problems in society.
One of the University's core values is to "ignite a lifelong love of learning" in students. Ohio State students benefit from a scholarly environment in which research inspires and informs teaching.
The Vice President for Student Life provides vision, leadership, and strategic direction to the Office of Student Life, a comprehensive unit dedicated to supporting the educational mission of the University and promoting the best possible overall experience for the diverse student body of approximately 60,000. The Office of Student Life supports every aspect of Ohio State students experience. Its scope includes housing, campus dining, disability services, the multicultural center, counseling and health services, student organizations and leadership development, and other related operations." [osu.edu/ vpsearch/ ]
The organizational chart example "University leadership" was created using the ConceptDraw PRO diagramming and vector drawing software extended with the Organizational Charts solution from the Management area of ConceptDraw Solution Park.
Organizational chart - University leadership

Create Graphs and Charts

- Pie Chart Of Environment And Sustainable Development
- Pie Chart Related To Environment Problems
- Pie Diagram Related To Environment Problem
- Marketing Environment Diagram Chart
- Flow Chart Of Types Of Business Environment
- Marketing Environment Flow Charts
- Draw A Flowchart Of Component Of Environment
- Draw A Chart On Components Of Environment
- Area Charts | Draw A Chart Related To Environmental Chemistry In Hd
- Draw A Chart Of Business Environment
- ERD | Entity Relationship Diagrams, ERD Software for Mac and Win
- Flowchart | Basic Flowchart Symbols and Meaning
- Flowchart | Flowchart Design - Symbols, Shapes, Stencils and Icons
- Flowchart | Flow Chart Symbols
- Electrical | Electrical Drawing - Wiring and Circuits Schematics
- Flowchart | Common Flowchart Symbols
- Flowchart | Common Flowchart Symbols