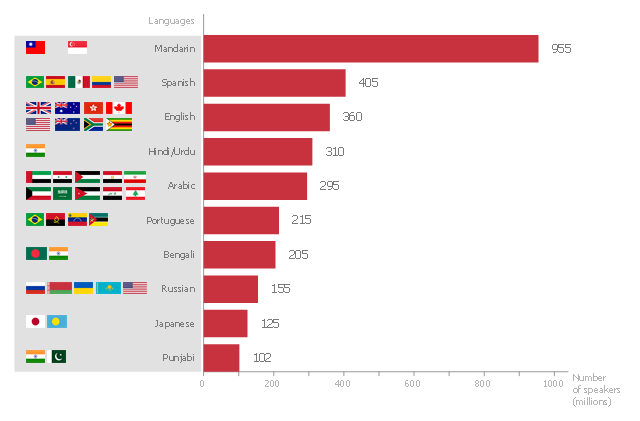
This bar graph sample shows the number of speakers for the most spoken languages of the world.
"In the philosophy of language, a natural language (or ordinary language) is any language which arises in an unpremeditated fashion as the result of the innate facility for language possessed by the human intellect. A natural language is typically used for communication, and may be spoken, signed, or written. Natural language is distinguished from constructed languages and formal languages such as computer-programming languages or the "languages" used in the study of formal logic, especially mathematical logic. ... Though the exact definition varies between scholars, natural language can broadly be defined in contrast on the one hand to artificial or constructed languages, computer programming languages like Python and international auxiliary languages like Esperanto, and on the other hand to other communication systems in nature, such as the waggle dance of bees. Although there are a variety of natural languages, any cognitively normal human infant is able to learn any natural language. By comparing the different natural languages, scholars hope to learn something about the nature of human intelligence and the innate biases and constraints that shape natural language, which are sometimes called universal grammar. The term "natural language" refers only a language that has developed naturally, and hence to actual speech, rather than prescribed speech. Hence, unstandardized speech (such as African American Vernacular English) is natural, whereas standardized speech such as Standard American English, which is in part prescribed, is somewhat artificial." [Natural language. Wikipedia]
The horizontal bar chart example "The most spoken languages of the world" was created using the ConceptDraw PRO diagramming and vector drawing software extended with the Bar Graphs solution from the Graphs and Charts area of ConceptDraw Solution Park.
Horizontal bar graph
Scientific Symbols Chart

Mathematics Solution from the Science and Education area of ConceptDraw Solution Park includes a few shape libraries of plane, solid geometric figures, trigonometrical functions and greek letters to help you create different professional looking mathematic illustrations for science and education.
This cycle diagram sample was created on the base of the figure illustrating the article "Environmental Materials" by Cris Arnold from the website of the UK Centre for Materials Education of the Higher Education Academy. "The figure ... schematically shows how the disparate areas under the heading of 'environmental materials' can be linked via a life cycle analysis approach. ...
Life Cycle Analysis.
Life Cycle Analysis is essentially a method of considering the entire environmental impact, energy and resource usage of a material or product. It is often known as a 'cradle-to-grave' analysis and can encompass the entire lifetime from extraction to end-of-life disposal. Life cycle analysis can be an extremely effective way of linking many different aspects of the environmental impacts of materials usage. ...
Materials Extraction and Resource Implications.
The environmental impact of raw materials extraction and processing together with global resource issues provides a good place to start consideration of environmental aspects of materials. ...
Environmental Impacts of Processing.
... Topics that would come under this subject area include the specific environmental problems associated with processing of metals, polymers, ceramics, composites etc, and how these problems can be overcome.
Design for Sustainability.
This area ... will ... cover issues such as design for successful recycling, waste minimisation, energy efficiency and increased lifetime.
Economic, Social and Legislative Issues.
... For example, materials selection within the automotive industry is now heavily influenced by 'end-of-life vehicle' and 'hazardous material' regulations.
Use of Sustainable Materials.
... It is probably sensible to define such materials as those that have distinct differences that achieve environmental benefit compared to conventional materials. With this definition, the list would include:
(1) Materials of a significantly plant-based nature, including wood, natural fibre composites, natural polymers.
(2) Materials produced using a large proportion of waste material, including recycled polymers, composites made from waste mineral powders, and arguably also much steel and aluminium.
Materials for Green Energy.
The most exciting developments in Materials Science are in the realm of functional materials, and many of these serve an environmentally-beneficial purpose, particularly in the production of green energy.
These include:
(1) Solar-cell materials.
(2) Fuel-cell technology.
(3) Catalytic pollution control.
End-of-Life Issues.
The treatment of materials at the end of their lifetime is a significant subject area and encompasses aspects such as recycling techniques and materials limitations, biodegradabilty and composting, chemical recovery and energy recovery." [materials.ac.uk/ guides/ environmental.asp]
The ring chart example "Life cycle analysis" was created using the ConceptDraw PRO diagramming and vector drawing software extended with the Target and Circular Diagrams solution from the Marketing area of ConceptDraw Solution Park.
www.conceptdraw.com/ solution-park/ marketing-target-and-circular-diagrams
Ring chart

Bar Diagram Math

How to Draw a Natural Landscape

Use Geography library of vector stencils to draw natural landscapes.
How can you illustrate the weather condition

Basic Diagramming Flowchart Software

The vector stencils library "Picture Graphs" contains 35 templates of picture bar graphs for visual data comparison and time series.
Drag a template from the library to your document, set bars number, type category labels, select bars and enter your data.
Use these shapes to draw your pictorial bar charts in the ConceptDraw PRO diagramming and vector drawing software.
The vector stencils library "Picture Graphs" is included in the Picture Graphs solution from the Graphs and Charts area of ConceptDraw Solution Park.
Arrow
Water drop

Food

Grain

Agriculture

Medicines

Houses

Buildings

Money bags

Oil barrels

Natural gas

Electrical power

Nuclear power

Mechanical engineering

Chemical industry

Mining

Gold bars

Coins

Person

Men, women and children

Man

Woman

Child

Milk

Meat

Fruits

Vegetables

Computer

Mobile phone

Airliner

Car

Bus

Truck

Train

Cargo ship

How to Create a Cross Functional Flow Chart

ConceptDraw Arrows10 Technology - This is more than enough versatility to draw any type of diagram with any degree of complexity.
Drawing software lets you to make horizontal and vertical, audit, opportunity and many more flowcharts.
Affinity Diagram

Drawing Illustration

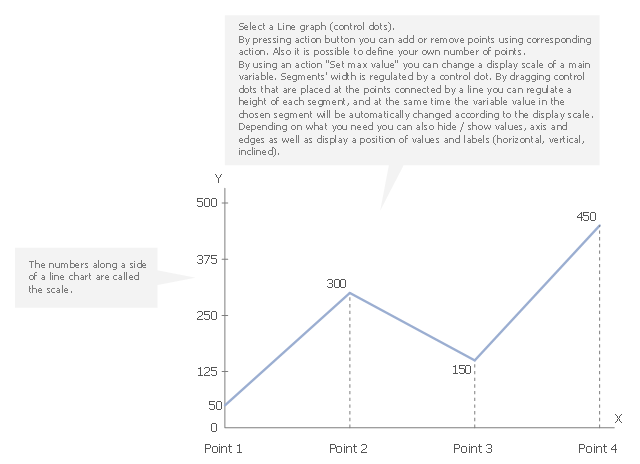
This line graph templates shows the number of tourists visiting the resort town for six months. Use it to design your time series line charts in ConceptDraw PRO diagramming and vector drawing software.
"A time series is a sequence of data points, measured typically at successive points in time spaced at uniform time intervals. ... Time series are very frequently plotted via line charts. Time series are used in statistics, signal processing, pattern recognition, econometrics, mathematical finance, weather forecasting, earthquake prediction, electroencephalography, control engineering, astronomy, and communications engineering. Time series analysis comprises methods for analyzing time series data in order to extract meaningful statistics and other characteristics of the data. Time series forecasting is the use of a model to predict future values based on previously observed values. While regression analysis is often employed in such a way as to test theories that the current values of one or more independent time series affect the current value of another time series, this type of analysis of time series is not called "time series analysis", which focuses on comparing values of time series at different points in time. Time series data have a natural temporal ordering." [Time series. Wikipedia]
The chart template "Line graph" is included in the Basic Line Graphs solution from the Graphs and Charts area of ConceptDraw Solution Park.
Chart template
Map Software

Beautiful Nature Scene: Drawing

Work Flow Process Chart

- Pie Chart On Natural Resource Management
- Natural Resources Pie Chart
- Pie Chart Natural Disaster In Mathematics
- How To Prepare A Pie Chart To Show The Natural Resources ...
- Conservation Of Natural Resources Pie Chart Maths
- Chart Which Can Be Prepared On Natural Resource Management
- Make A Flow Chart Classifying Various Natural Resources With ...
- Flow Chart On Classification Of Natural Resources With Eg
- Energy resources diagram | Chart On Conservation Of Natural ...
- Graphs And Pie Chart On Conservation Of Natural Resources
- Drawing Of Flow Chart On Natural Resources Classification
- Affinity Diagram | Life cycle analysis - Ring chart | Pyramid Chart ...
- Natural Resources Types And Classification Chart
- Flow Chart Of Natural Resources With Meaning And Examples
- Flowchart Of Classification Of Natural Resources With Examples
- Management Of Natural Resource In Mathematics Pie Chart
- Flow Chart On Classification Of Natural Resources With Examples
- Natural Resources Prepare A Flow Chart
- Natural gas condensate - PFD | Process Flow Chart | Types of ...
- Pie Chart For Conservation Of Natural Resources
- ERD | Entity Relationship Diagrams, ERD Software for Mac and Win
- Flowchart | Basic Flowchart Symbols and Meaning
- Flowchart | Flowchart Design - Symbols, Shapes, Stencils and Icons
- Flowchart | Flow Chart Symbols
- Electrical | Electrical Drawing - Wiring and Circuits Schematics
- Flowchart | Common Flowchart Symbols
- Flowchart | Common Flowchart Symbols