"Feedback is a process in which information about the past or the present influences the same phenomenon in the present or future. As part of a chain of cause-and-effect that forms a circuit or loop, the event is said to "feed back" into itself. ...
Feedback loop - the complete causal path that leads from the initial detection of the gap to the subsequent modification of the gap. ...
Feedback is commonly divided into two types - usually termed positive and negative. The terms can be applied in two contexts:
(1) the altering of the gap between reference and actual values of a parameter, based on whether the gap is widening (positive) or narrowing (negative),
(2) the valence of the action or effect that alters the gap, based on whether it has a happy (positive) or unhappy (negative) emotional connotation to the recipient or observer." [Feedback. Wikipedia]
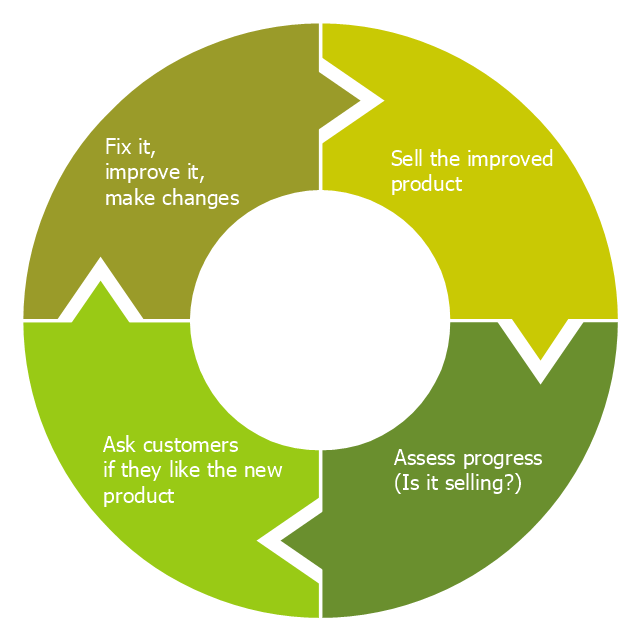
This cycle diagram example was redesigned from the Wikimedia Commons file: Business Feedback Loop.jpg. [commons.wikimedia.org/ wiki/ File:Business_ Feedback_ Loop.jpg]
This file is made available under the Creative Commons CC0 1.0 Universal Public Domain Dedication. [creativecommons.org/ publicdomain/ zero/ 1.0/ deed.en]
The ring chart example "Business feedback loop" was created using the ConceptDraw PRO diagramming and vector drawing software extended with the Target and Circular Diagrams solution from the Marketing area of ConceptDraw Solution Park.
www.conceptdraw.com/ solution-park/ marketing-target-and-circular-diagrams
Feedback loop - the complete causal path that leads from the initial detection of the gap to the subsequent modification of the gap. ...
Feedback is commonly divided into two types - usually termed positive and negative. The terms can be applied in two contexts:
(1) the altering of the gap between reference and actual values of a parameter, based on whether the gap is widening (positive) or narrowing (negative),
(2) the valence of the action or effect that alters the gap, based on whether it has a happy (positive) or unhappy (negative) emotional connotation to the recipient or observer." [Feedback. Wikipedia]
This cycle diagram example was redesigned from the Wikimedia Commons file: Business Feedback Loop.jpg. [commons.wikimedia.org/ wiki/ File:Business_ Feedback_ Loop.jpg]
This file is made available under the Creative Commons CC0 1.0 Universal Public Domain Dedication. [creativecommons.org/ publicdomain/ zero/ 1.0/ deed.en]
The ring chart example "Business feedback loop" was created using the ConceptDraw PRO diagramming and vector drawing software extended with the Target and Circular Diagrams solution from the Marketing area of ConceptDraw Solution Park.
www.conceptdraw.com/ solution-park/ marketing-target-and-circular-diagrams
Ring chart
"Feedback is a process in which information about the past or the present influences the same phenomenon in the present or future. As part of a chain of cause-and-effect that forms a circuit or loop, the event is said to "feed back" into itself. ...
Feedback loop - the complete causal path that leads from the initial detection of the gap to the subsequent modification of the gap. ...
Feedback is commonly divided into two types - usually termed positive and negative. The terms can be applied in two contexts:
(1) the altering of the gap between reference and actual values of a parameter, based on whether the gap is widening (positive) or narrowing (negative),
(2) the valence of the action or effect that alters the gap, based on whether it has a happy (positive) or unhappy (negative) emotional connotation to the recipient or observer." [Feedback. Wikipedia]
This cycle diagram example was redesigned from the Wikimedia Commons file: Business Feedback Loop.jpg. [commons.wikimedia.org/ wiki/ File:Business_ Feedback_ Loop.jpg]
This file is made available under the Creative Commons CC0 1.0 Universal Public Domain Dedication. [creativecommons.org/ publicdomain/ zero/ 1.0/ deed.en]
The ring chart example "Business feedback loop" was created using the ConceptDraw PRO diagramming and vector drawing software extended with the Target and Circular Diagrams solution from the Marketing area of ConceptDraw Solution Park.
www.conceptdraw.com/ solution-park/ marketing-target-and-circular-diagrams
Ring chart
Social Media Response Management Action Maps - software tool


This cycle process chart was redesigned from the Wikimedia Commons file: Business Feedback Loop PNG version.png.
"A business ideally is continually seeking feedback from customers: are the products helpful? are their needs being met? Constructive criticism helps marketers adjust offerings to meet customer needs."
[commons.wikimedia.org/ wiki/ File:Business_ Feedback_ Loop_ PNG_ version.png]
The cycle process diagram example "Business feedback loop" was created using the ConceptDraw PRO diagramming and vector drawing software extended with the Sales Flowcharts solution from the Marketing area of ConceptDraw Solution Park.
Customers feedback cycle process chart

This ring chart sample was redesigned from the Wikipedia file: Virtuous circle in management.svg.
"An example of the use of a virtuous circle in management."
[en.wikipedia.org/ wiki/ File:Virtuous_ circle_ in_ management.svg]
"A virtuous circle and a vicious circle (also referred to as virtuous cycle and vicious cycle) are economic terms. They refer to a complex chain of events that reinforces itself through a feedback loop. A virtuous circle has favorable results, while a vicious circle has detrimental results.
Both circles are complexes of events with no tendency towards equilibrium (at least in the short run). Both systems of events have feedback loops in which each iteration of the cycle reinforces the previous one (positive feedback). These cycles will continue in the direction of their momentum until an external factor intervenes and breaks the cycle. The prefix "hyper-" is sometimes used to describe these cycles if they are extreme. The best-known example of a vicious circle is hyperinflation. ...
Example in management.
Virtuous circle.
An employer's investment in his employees’ ability to provide superior service to customers can be seen as a virtuous circle. Effort spent in selecting and training employees and creating a corporate culture in which they are empowered can lead to increased employee satisfaction and employee competence. This can result in superior service delivery and customer satisfaction. This in turn will create customer loyalty, improved sales levels, and higher profit margins. Some of these profits can be reinvested in employee development, thereby initiating another iteration of a virtuous cycle." [en.wikipedia.org/ wiki/ Virtuous_ circle_ and_ vicious_ circle]
The ring chart example "Virtuous circle (management)" was created using the ConceptDraw PRO diagramming and vector drawing software extended with the Target and Circular Diagrams solution from the Marketing area of ConceptDraw Solution Park.
www.conceptdraw.com/ solution-park/ marketing-target-and-circular-diagrams
Ring chart
---ring-chart.png--diagram-flowchart-example.png)
Social Media Response Management DFD Charts - software tools

How to Create a Social Media DFD Flowchart

It allows companies to be more effective in timely messaging thanks to the ability for rapid response to a customer′s post in social media. This saves budget for companies who use social media for promoting and as a lead generation tool.
Response to Customer Negative Feedback

Interactive Flowcharts can change the way one creates and organizes their social media response process.
Provide Team Training

Basic Flowchart Symbols and Meaning


Manage Social Media Response Plan DFD

Social Media Response DFD Flowcharts - diagramming software ( Mac PC )

Quality Control Chart Software — ISO Flowcharting

The quality control chart is a graphic that illustrates the accordance of processes or products to the intended specifications and degree of differences from them. Depending on what type of data you need analyze, there are used different types of quality control charts: X-bar charts, S charts, Np charts.
What Is an Action Mind Map

- Business feedback loop - Ring chart
- Basic Flowchart Symbols and Meaning | Business feedback loop ...
- Circular diagrams - Vector stencils library | Business feedback loop ...
- Simple Feedback Loop Chart
- Business feedback loop - Ring chart
- Positive Influencer Feedback | Six Markets Model Chart | Mindmap ...
- Business feedback loop - Ring chart | Target And Actual Donut Graph
- Basic Flowchart Symbols and Meaning | Flow Chart Symbols ...
- Hotel Customer Feedback Cycle
- Doughnut chart - Template | Virtuous circle (management) - Ring ...
- Pie Chart Examples and Templates | Pie Chart Software | Doughnut ...
- Pie Donut Chart . Pie Chart Examples
- Flow chart Example. Warehouse Flowchart
- Virtuous circle (management) - Ring chart | Pie Chart Examples and ...
- Bank Customer Positive Feedback | Response to Customer ...
- Sales Feedback Loop Flow Chart
- Flow Chart Of Feedback System
- Product Suggestions Feedback Loop Flow Chart
- How to Draw the Different Types of Pie Charts | National ...
- Pie Chart Software | Pie Chart Examples and Templates | Pie Donut ...
- ERD | Entity Relationship Diagrams, ERD Software for Mac and Win
- Flowchart | Basic Flowchart Symbols and Meaning
- Flowchart | Flowchart Design - Symbols, Shapes, Stencils and Icons
- Flowchart | Flow Chart Symbols
- Electrical | Electrical Drawing - Wiring and Circuits Schematics
- Flowchart | Common Flowchart Symbols
- Flowchart | Common Flowchart Symbols