This site uses cookies. By continuing to browse the ConceptDraw site you are agreeing to our Use of Site Cookies.
HelpDesk

How to Add a Bubble Diagram to MS Word

A bubble diagram is used the same purpose as a scatter diagram, but in the case, if the data has three dimensions, each of that containing the set of values. A bubble chart is a diagram in which the data points are replaced with bubbles, and the size of the bubbles represents some additional dimension of the data. A bubble chart does not have the axis. The sizes of the bubbles are determined by the values in the third dimension. Any additional information about the entities beyond their three primary dimensions can be depicted by rendering bubbles in colors and patterns that are selected in a certain way. The legend containing the further information can be added to a bubble diagram. ConceptDraw DIAGRAM allows you to easily create various business management and marketing charts, including bubble diagrams and then add them to an MS Word document.
HelpDesk

How to Add a Circle-Spoke Diagram to MS Word Document

ConceptDraw DIAGRAM allows you to easily create various marketing charts, including the circle-spoke diagrams and then insert them into an MS Word document.

Bar Chart Template for Word

All these bar chart templates are included in the Bar Graphs solution.
You can quickly rework these bar graph templates into your own charts by simply changing displayed data, title and legend texts.

Venn Diagram Template for Word

This template shows the Venn Diagram. It was created in ConceptDraw DIAGRAM diagramming and vector drawing software using the ready-to-use objects from the Venn Diagrams Solution from the "Diagrams" area of ConceptDraw Solution Park.
HelpDesk

How to Add a Fishbone (Ishikawa) Diagram to an MS Word Document
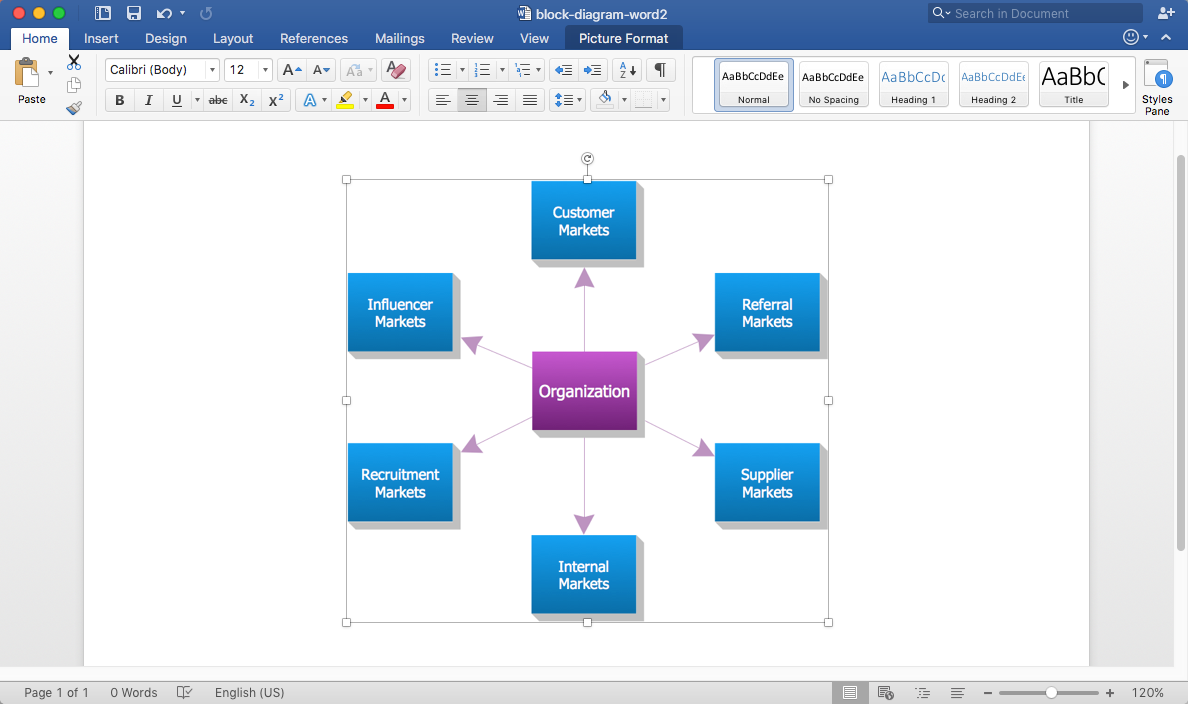
The ability to create a fishbone (Ishikawa) Diagram is supported by the ConceptDraw Fishbone Diagram solution. ConceptDraw DIAGRAM allows you to easily create fishbone diagrams and then insert them into an MS Word document.
HelpDesk

How to Add a Block Diagram to an MS Word ™ Document

Block diagram consists of graphic blocks. Blocks are connected by lines or arrows. Block diagrams are used to show the relationship between parts of some systems. It can be used for the development of new systems or to improve existing ones. The structure of the block diagram gives a high-level overview of the major components of the system, as well as the important relationships. Using the block diagrams, you can more effectively present the business data contained in your MS Word documents. ConceptDraw DIAGRAM allows you to easily create block diagrams and then insert them into an MS Word document.

Pie Chart Word Template. Pie Chart Examples
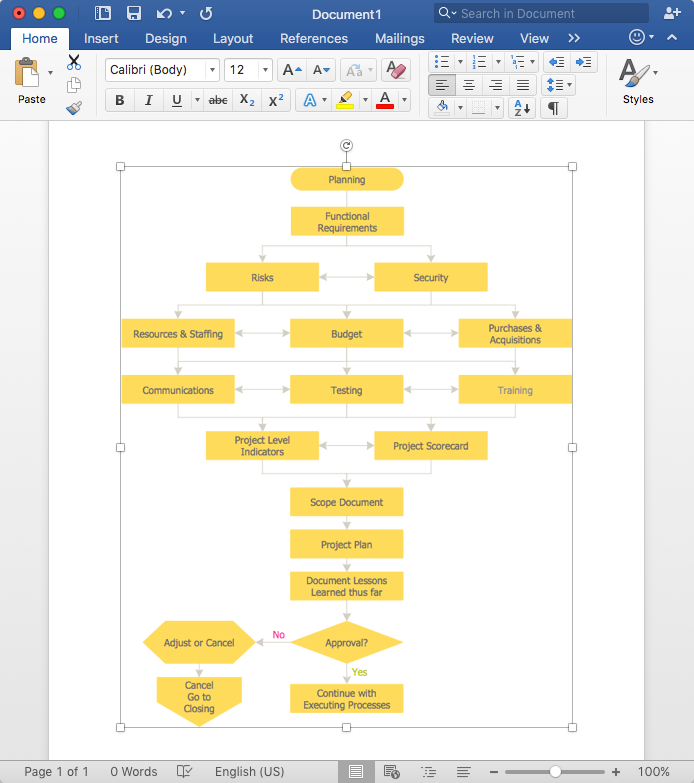
The Pie Chart visualizes the data as the proportional parts of a whole and looks like a disk divided into sectors. The pie chart is type of graph, pie chart looks as circle devided into sectors. Pie Charts are widely used in the business, statistics, analytics, mass media. It’s very effective way of displaying relative sizes of parts, the proportion of the whole thing.
HelpDesk

How to Add a Flowchart to MS Word Document

ConceptDraw DIAGRAM allows you to easily create flowcharts and then insert them into a MS Word document.

Line Chart Template for Word

This sample was created in ConceptDraw DIAGRAM diagramming and vector drawing software using the Line Graphs Solution from Graphs and Charts area of ConceptDraw Solution Park.
This sample shows the Line Chart of annual percentage change. The Line Chart allows you to clearly see the changes of data over the time.
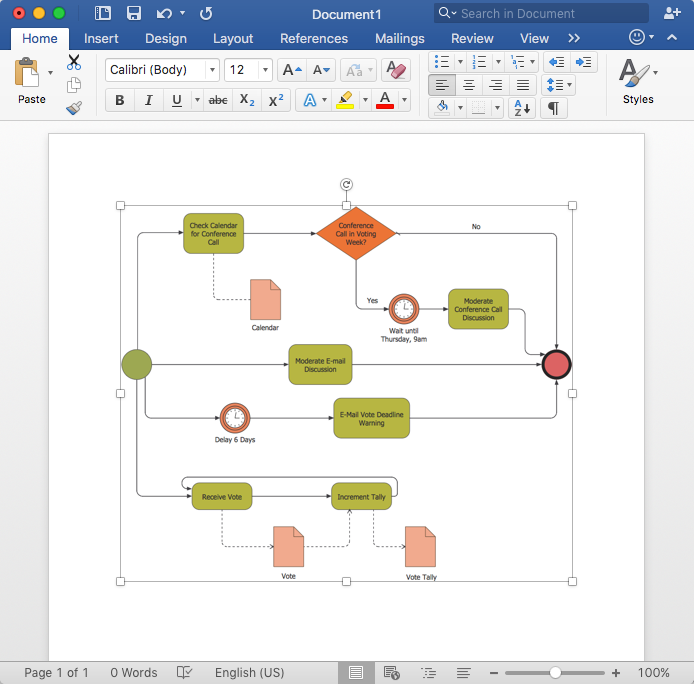
HelpDesk

How to Add a Business Process Diagram to MS Word Document

ConceptDraw DIAGRAM allows you to easily create business process diagrams and then add them to an MS Word document.