Process Flowchart


Activity Network (PERT) Chart

This diagram is constructed as part of the process in creating a schedule of corrective actions. The Activity Network Chart (PERT) shows the logical connections and consequence of tasks to be performed. It displays the time period for problem solving and the implementation of all activities through the critical path.
Basic Flowchart Symbols and Meaning


How to Discover Critical Path on a Gantt Chart

Gant Chart in Project Management


Social Media Response Management DFD Charts - software tools


This ring chart sample was redesigned from the Wikipedia file: Virtuous circle in management.svg.
"An example of the use of a virtuous circle in management."
[en.wikipedia.org/ wiki/ File:Virtuous_ circle_ in_ management.svg]
"A virtuous circle and a vicious circle (also referred to as virtuous cycle and vicious cycle) are economic terms. They refer to a complex chain of events that reinforces itself through a feedback loop. A virtuous circle has favorable results, while a vicious circle has detrimental results.
Both circles are complexes of events with no tendency towards equilibrium (at least in the short run). Both systems of events have feedback loops in which each iteration of the cycle reinforces the previous one (positive feedback). These cycles will continue in the direction of their momentum until an external factor intervenes and breaks the cycle. The prefix "hyper-" is sometimes used to describe these cycles if they are extreme. The best-known example of a vicious circle is hyperinflation. ...
Example in management.
Virtuous circle.
An employer's investment in his employees’ ability to provide superior service to customers can be seen as a virtuous circle. Effort spent in selecting and training employees and creating a corporate culture in which they are empowered can lead to increased employee satisfaction and employee competence. This can result in superior service delivery and customer satisfaction. This in turn will create customer loyalty, improved sales levels, and higher profit margins. Some of these profits can be reinvested in employee development, thereby initiating another iteration of a virtuous cycle." [en.wikipedia.org/ wiki/ Virtuous_ circle_ and_ vicious_ circle]
The ring chart example "Virtuous circle (management)" was created using the ConceptDraw PRO diagramming and vector drawing software extended with the Target and Circular Diagrams solution from the Marketing area of ConceptDraw Solution Park.
www.conceptdraw.com/ solution-park/ marketing-target-and-circular-diagrams
Ring chart
---ring-chart.png--diagram-flowchart-example.png)
Types of Flowchart - Overview


Bar Diagrams for Problem Solving. Create business management bar charts with Bar Graphs Solution

PERT Chart Software

ConceptDraw PRO is a powerful diagramming and vector drawing software for designing professional looking PERT Charts quick and easy.
Flow chart Example. Warehouse Flowchart

Standard warehousing process flow diagram and standard workflow diagram used for process identification for further evaluating effectiveness and profitability of overall business process. Use the ConceptDraw PRO diagramming and vector drawing software extended with the Flowcharts solution from the Diagrams area of ConceptDraw Solution Park to design your own workflow diagrams, process flow diagram and flow charts. Need to use Process Flow Diagram for designing Warehouse packages flow.

HelpDesk
How to Create Organizational Chart Using Management Solution

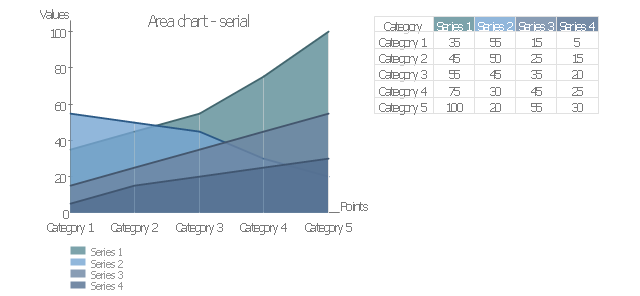
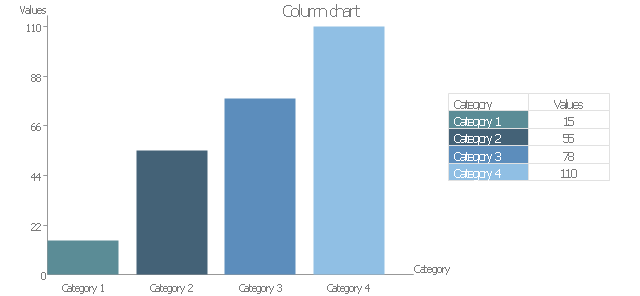
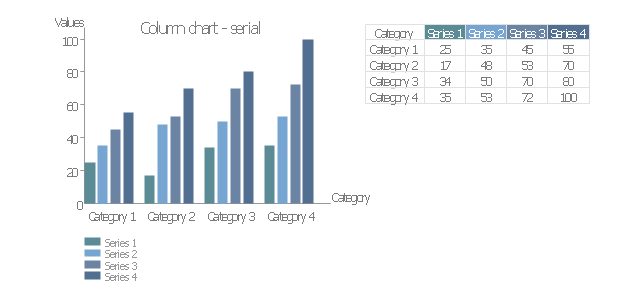
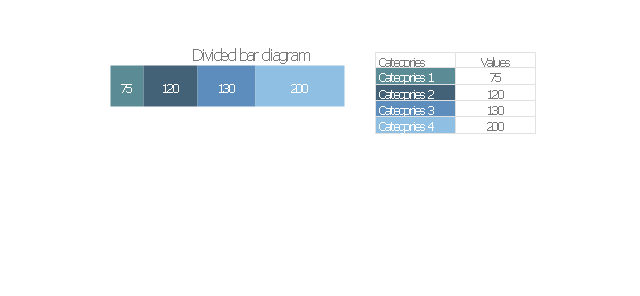
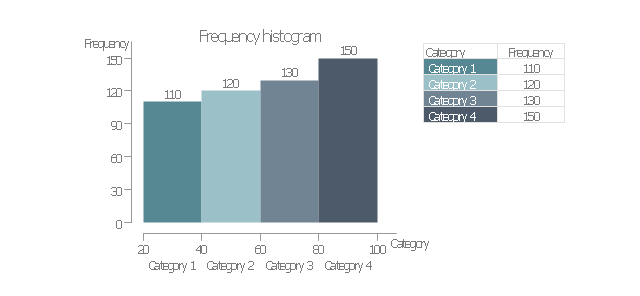
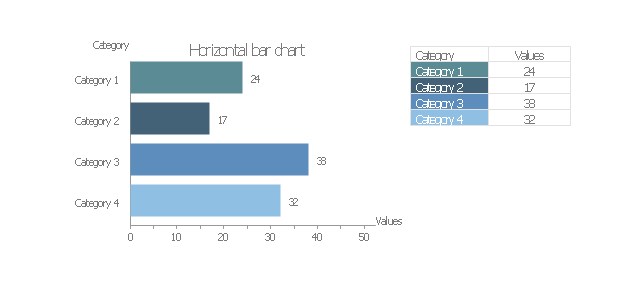
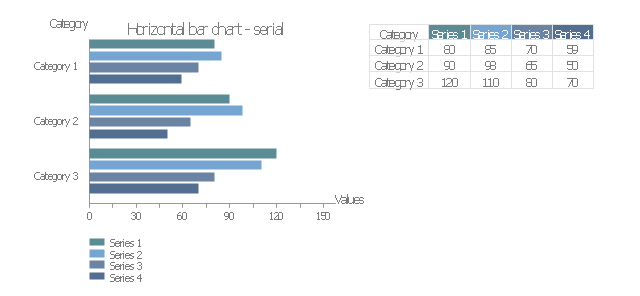
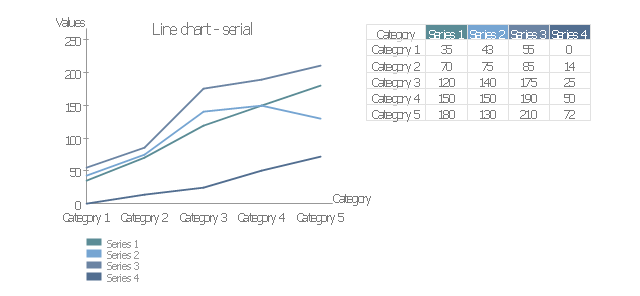
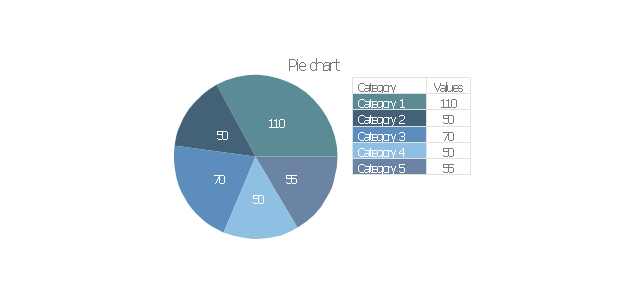
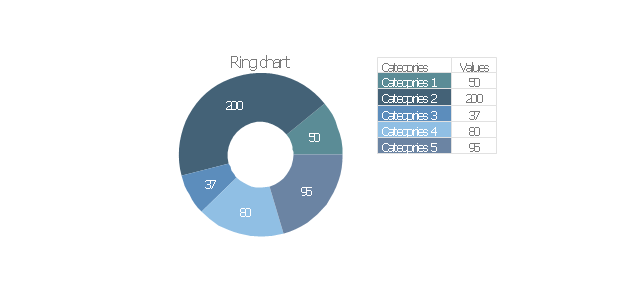
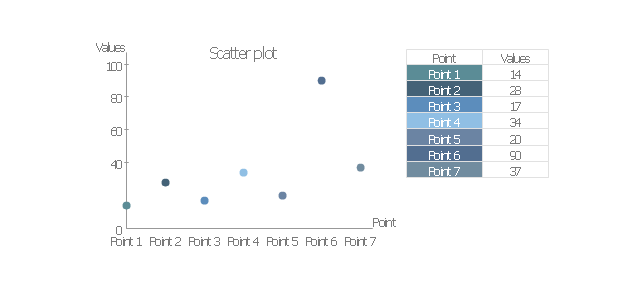
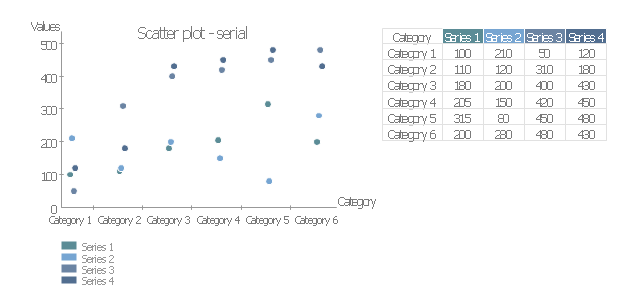
The vector stencils library "Management charts" contains 12 graphs and charts: area chart, column chart, divided bar diagram, histogram, horizontal bar graph, line graph, pie chart, ring chart, scatter plot.
Use it to create your management infogram in the ConceptDraw PRO diagramming and vector drawing software.
The graphs example "Management charts - Vector stencils library" is included in the solution "Marketing infographics" from the "Business infographics" area of ConceptDraw Solution Park.
Use it to create your management infogram in the ConceptDraw PRO diagramming and vector drawing software.
The graphs example "Management charts - Vector stencils library" is included in the solution "Marketing infographics" from the "Business infographics" area of ConceptDraw Solution Park.
Area chart - serial
Column chart
Column chart - serial
Divided bar diagram
Frequency histogram
Horizontal bar chart
Horizontal bar chart - serial
Line chart - serial
Pie chart
Ring chart
Scatter plot
Scatter plot - serial
Bar Diagrams for Problem Solving. Create event management bar charts with Bar Graphs Solution

"A project network is a graph (flow chart) depicting the sequence in which a project's terminal elements are to be completed by showing terminal elements and their dependencies.
... the project network shows the "before-after" relations.
The most popular form of project network is activity on node, the other one is activity on arrow.
The condition for a valid project network is that it doesn't contain any circular references." [Project network. Wikipedia]
The PERT chart example "Project management plan" was created using the ConceptDraw PRO diagramming and vector drawing software extended with the solution "Seven Management and Planning Tools" from the Management area of ConceptDraw Solution Park.
PERT

Legend

- Chart Of Management Information System With Diagram
- Human Resource Development | Gant Chart in Project Management ...
- Gant Chart in Project Management | How to Discover Critical Path ...
- Project management life cycle - Flowchart | Program to Make Flow ...
- Gantt chart examples | Gant Chart in Project Management | How to ...
- How to Draw an Organization Chart | Organizational Structure ...
- Store Management Process Flow Chart
- Hr Management Flow Chart
- School Management Structure In A Flow Diagram
- Gantt chart examples | Gant Chart in Project Management | Gantt ...
- How to Draw an Organization Chart
- Flow chart Example. Warehouse Flowchart | Identifying Quality ...
- Human Resource Development | Gantt chart examples | Gant Chart ...
- Software Project Management Sample Project Gantt Chart
- Construction Project Chart Examples | Gantt chart examples | Gant ...
- HR Flowchart Symbols | HR management process - Flowchart ...
- Program to Make Flow Chart | Project management life cycle ...
- Logistics Management Flow Chart And Details
- PERT chart - Template | PERT chart - Project management plan ...
- Management Flow Chart Examples
- ERD | Entity Relationship Diagrams, ERD Software for Mac and Win
- Flowchart | Basic Flowchart Symbols and Meaning
- Flowchart | Flowchart Design - Symbols, Shapes, Stencils and Icons
- Flowchart | Flow Chart Symbols
- Electrical | Electrical Drawing - Wiring and Circuits Schematics
- Flowchart | Common Flowchart Symbols
- Flowchart | Common Flowchart Symbols